
A company can grow 30% in a year, post its best gross margin ever, and still miss a Friday payroll. Working capital is the gap between the day you record the profit and the day the cash lands. This page is built to route you: every section gives the short answer and names the article that carries the full one. If you already know the question you came with, jump to it in the list below. If you do not, start with the decision guide, which sorts the problem into timing, profitability, balance-sheet structure or financing capacity before you spend money on any of them.
What this guide covers
- What working capital is and who needs it
- How to decide which working-capital path you are on
- How working capital is calculated
- What the current ratio and quick ratio tell you
- How the cash conversion cycle changes cash day to day
- How to build a working-capital forecast
- How to improve working capital without hurting sales
- What working-capital financing options cost and when each fits
- When to hire a pro for working capital

What working capital is and who needs it
Working capital is current assets minus current liabilities: cash, receivables, inventory and prepaids on one side, payables, accrued payroll, accrued taxes and short-term debt on the other. It measures how much of your funding sits inside the operating cycle instead of in the bank. Managed well, it buys operational flexibility, meaning the room to take a large order, hold a season of stock, or wait out a slow customer without borrowing.
Take a wholesaler doing $18 million in revenue at a 24% gross margin. Every $1 million of new sales requires roughly $115,000 of added inventory and $150,000 of added receivables at net 45 terms, offset by maybe $60,000 of additional payables. Net cost of that growth: about $205,000, spent before a dollar of it comes back. The order looks like a win in the P&L and a withdrawal in the bank account.
Five situations put the number in play:
- Growth with a receivables lag. Sales rise, collections follow 30 to 60 days later, and the gap has to be funded.
- Inventory-heavy operations. Goods are bought and paid for before a customer ever sees them.
- Seasonal swings. A peak season requires a cash build months before revenue lands.
- Supplier-term pressure. A vendor cuts terms from net 45 to net 15, or to cash on delivery, and the cycle shortens overnight.
- Timing gaps before customer payment. Payroll runs every two weeks no matter what the aging report says.
How to decide which working-capital path you are on
Before you reduce inventory, chase collections, renegotiate supplier terms, or apply for a facility, decide which of four problems you actually have. Fixing a timing problem with a loan is expensive. Fixing a profitability problem with a loan is dangerous.
Decision Guide: which problem is this?
- Timing problem. The business is profitable, margins hold, but cash arrives after obligations are due. The fix is a weekly liquidity view and tighter collection and billing cadence. Start with the short-term cash view (“13 week cash flow” covers the weekly model in full).
- Profitability problem. Cash is short every month regardless of collections, and some customers or projects lose money at the contribution-margin line. The fix is pricing and mix. Not financing. (“free cash flow” carries the full treatment of what the business actually generates after operating needs.)
- Balance-sheet structure problem. Cash is trapped in slow inventory, aged receivables, or deposits, while short-term debt funds long-term assets. The fix is structural: release the trapped balances, then term out the right debt.
- Financing-capacity problem. The gap is real, forecastable and temporary, and internal levers are already pulled. Now a line of credit or asset-based facility is the correct tool.
- Visibility problem. You cannot tell which of the four you have. That is the most common answer, and it is a reporting problem, not a finance problem. (“cash flow forecast” walks through whether building a forward view is worth it, and “cash flow statement” explains how to read the warning signs already sitting in your financials.)
One test settles most cases in ten minutes. Pull the last twelve months of gross profit dollars and compare them to the change in cash. If gross profit grew and cash fell, look at receivables, inventory and payables. If gross profit was flat or shrinking while revenue grew, the problem sits in pricing and mix, and no facility will repair it.
How working capital is calculated
Three measures share the name. Gross working capital is total current assets. Net working capital subtracts current liabilities from them. Trade or operating working capital drops cash and debt and looks only at the balances the operating cycle creates. The Securities and Exchange Commission uses the simple balance-sheet version in its investor guidance, while accounting standards do not always use one universal definition of the term.
| Formula | What it is | When to use it |
|---|---|---|
| Net working capital (balance sheet) | Current assets minus current liabilities, cash included | Liquidity snapshot, covenant tests, lender packages |
| Operating working capital | (AR + inventory + prepaids) minus (AP + accruals), cash and debt excluded | Understanding how much cash the operating cycle consumes |
| Change in non-cash working capital | This period’s operating working capital minus last period’s | Forecasting, valuation, and explaining why profit did not become cash |
Cash counts in the first formula and comes out of the second. That single distinction resolves most of the confusion. When you want to know whether you can meet obligations this quarter, include cash. When you want to know how much funding growth will absorb, exclude it, because cash is the result you are solving for, not an input.
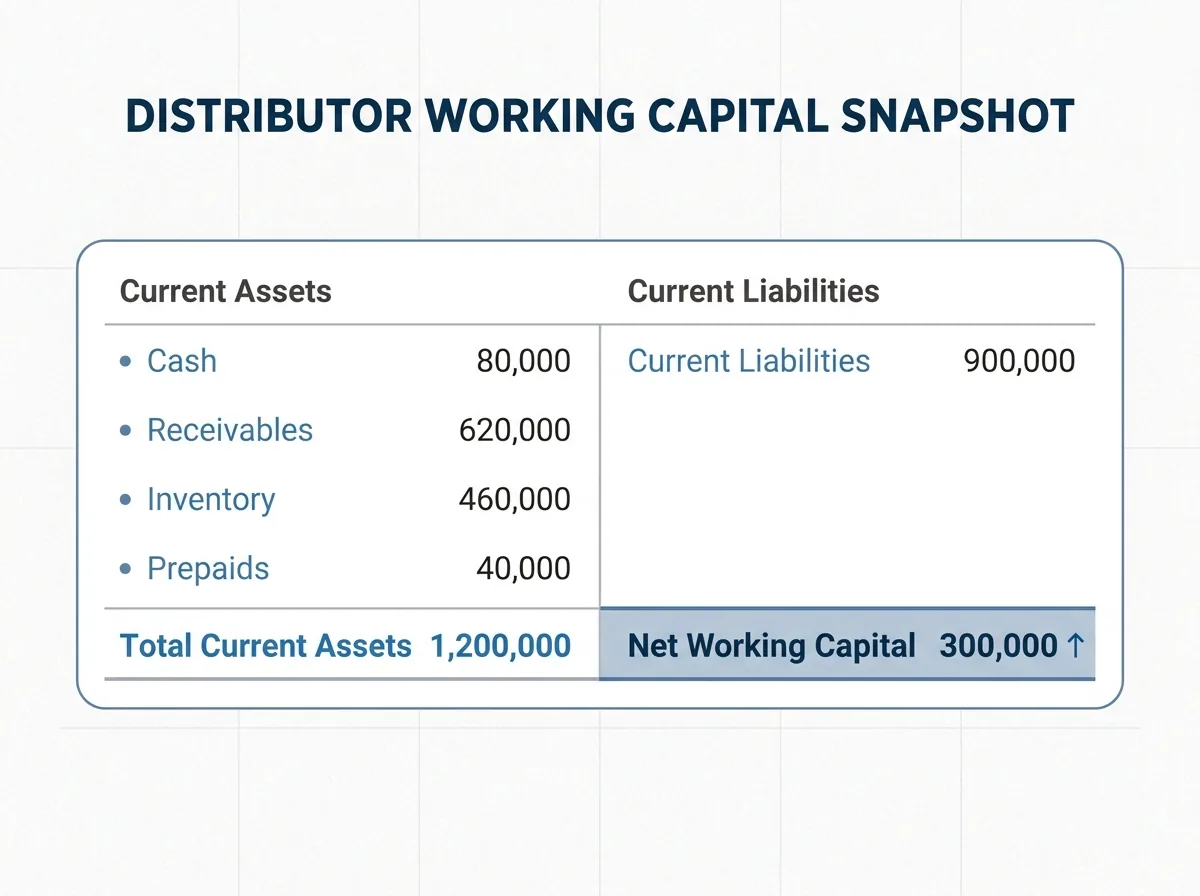
Here is the case that makes the point. A distributor’s balance sheet shows $1.2 million in current assets: $80,000 cash, $620,000 receivables, $460,000 inventory, $40,000 prepaids. Current liabilities are $900,000. Net working capital is a healthy-looking positive $300,000. Now look inside. Payroll of $95,000 clears Friday, $210,000 of the receivables are more than 60 days past due, and $130,000 of inventory has not moved in a year. Available cash is $80,000. The company is solvent on paper and short by $15,000 in the bank, which is the only number the payroll provider cares about.
Increases in receivables and inventory are uses of cash and increases in payables are sources of cash, which is why the cash-flow statement can show working capital as a drain in a year when the balance sheet looks stronger. The reconciliation mechanics live in “operating cash flow formula“.
What the current ratio and quick ratio tell you
The current ratio, also called the working capital ratio, divides current assets by current liabilities. The quick ratio strips inventory out first, which matters when stock is specialized, seasonal or slow to move. The cash ratio counts only cash against current liabilities. I treat all three as screening tools, because a ratio above 1 has convinced more than one owner that nothing needed attention until a supplier moved the account to cash on delivery.
Read any ratio next to three things: the aging schedule by customer, inventory turns by SKU class, and the next six weeks of obligations. “cash flow statement” covers the warning signs already sitting in your financials, and “cash flow forecast” takes apart the forward view that tells you what cash looks like in 90 days.
How the cash conversion cycle changes cash day to day
The cash conversion cycle is days inventory outstanding plus days sales outstanding minus days payable outstanding. It counts the days your money sits between paying a supplier and collecting from a customer, and each of those days carries roughly one day of operating cost. Growth multiplies it: at a 60-day cycle and $40,000 of daily cost of sales the business carries about $2.4 million in the cycle, and 25% more revenue at the same days needs about $600,000 more funding.
Service firms feel it with no inventory at all. A marketing agency paying media and freelancers on net 15 while enterprise clients pay on net 60 through an AP portal funds a 52-day cycle itself, so a large new retainer feels like a loss for two months. The weekly view of that same picture is covered in “13 week cash flow“.
How to build a working-capital forecast
Two forecasts do two different jobs. A short-term weekly liquidity forecast, usually 13 weeks, answers whether payroll, rent, taxes and critical suppliers clear on the dates they are due. It runs on actual receipts and scheduled disbursements. A 12-month planning forecast answers how much capital the year requires and when the seasonal trough hits. It runs on drivers month by month, because an annual average hides the trough entirely.
The inputs that move the answer, in order of impact:
- Collection curve by customer segment, not average DSO. Split receivables into what pays on time, what pays at 45, and what pays at 75 or later.
- Inventory build timing ahead of the season, with supplier lead times and minimum order quantities as they actually are.
- Payroll dates, including the three-payroll months if you run biweekly.
- Taxes: payroll deposits, sales tax remittances, and estimated income tax.
- Supplier terms by vendor, including any early-payment discounts you are choosing to take.
- Debt service and covenant test dates.
- A minimum-cash floor you refuse to breach, set in dollars.
Days convert to dollars in one line. Daily cost of sales of $22,000 with a 69-day cycle puts roughly $1.5 million in the cycle at steady state, and that is a specific number you can take to a bank instead of a vague request for a line of credit.
If you want a second set of eyes on the trough before you commit to a facility, a short conversation about your numbers is usually faster than another month of spreadsheet revisions.

How to improve working capital without hurting sales
Most companies can release 10% to 20% of the cash sitting in their cycle before they borrow a dollar, and the levers are boring: call at day 3 past due instead of day 45, bill weekly instead of at month end, take deposits and milestone payments, set reorder points by SKU velocity class, ask for 45-day terms where you have 30 and then pay on the date agreed, and know contribution margin by customer. Digital payment and collection rails belong on the same list, since card and ACH acceptance with same-day bank visibility move money days earlier than checks and cost far less than a facility.
At CertiPay, a platform modernization cut labor cost 17% and produced the company’s first customer-profitability reporting. That was my seat as CFO rather than a fractional engagement, and it made one thing obvious: until you can see margin by customer, every cash conversation is guesswork. When a specific lever is already broken, collections stalling or inventory bloating, “cash flow problems” is the fix-it guide.
What working-capital financing options cost and when each fits
Finance a gap that is temporary, forecastable and covered by repayment capacity. Solve internally anything caused by late invoicing, weak collections, obsolete inventory or unprofitable work, because a facility on top of a broken process just adds interest to the same problem.
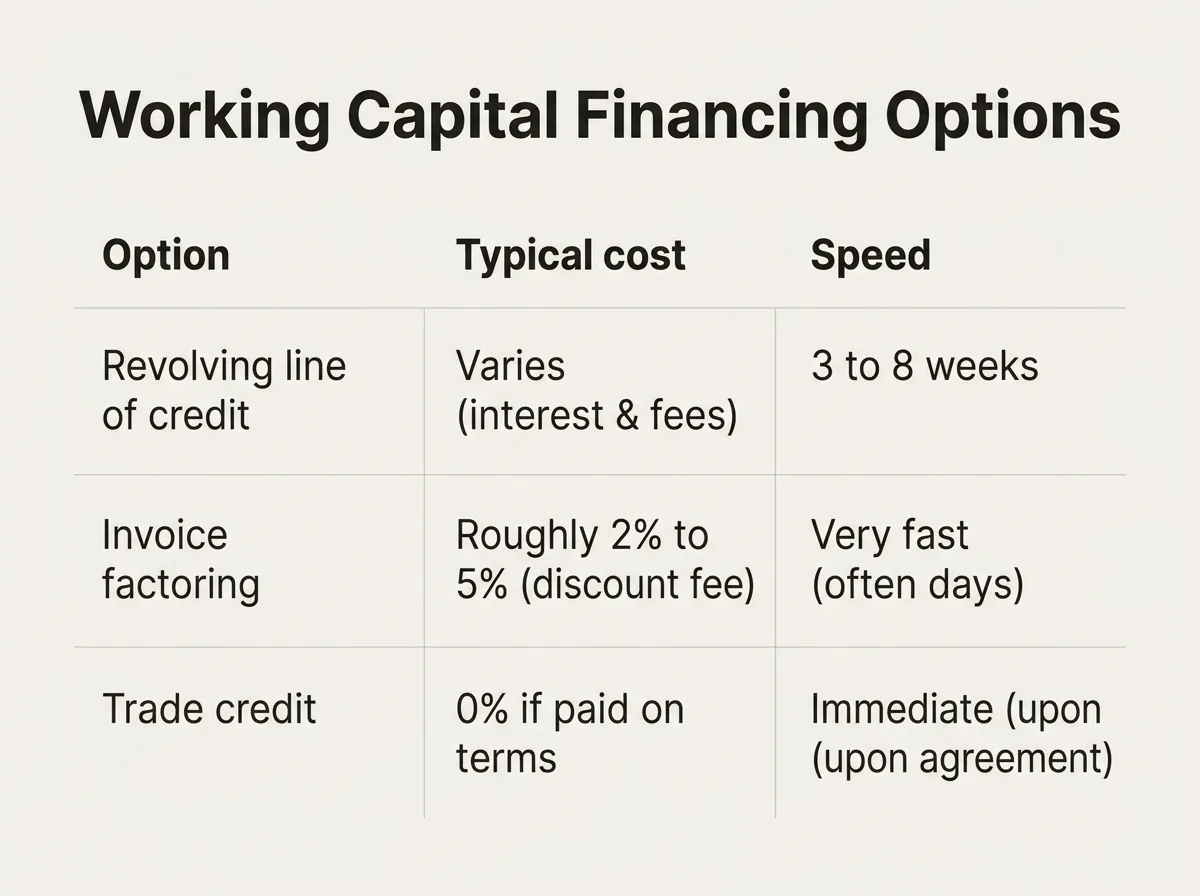
| Option | Typical cost | Speed | Collateral / limit | Best fit |
|---|---|---|---|---|
| Revolving line of credit | Prime plus a spread, plus unused-line fees | 3 to 8 weeks | Blanket lien, covenants, sometimes a borrowing base | Recurring seasonal swings in a bankable company |
| SBA-backed working capital loan | Prime plus a lender spread, plus guarantee and packaging fees | 4 to 12 weeks | First lien on trading assets; borrowing-base certificate on CAPLine structures | Longer funding need, thinner collateral, patient timeline |
| Invoice factoring | Roughly 2% to 5% discount per invoice period | Days to 2 weeks | Advance of about 80% to 90% of eligible invoices | Fast cash, concentrated creditworthy customers, weak balance sheet |
| Asset-based lending | Interest plus monitoring and audit fees | 4 to 8 weeks | Borrowing base: eligible AR plus a lower advance on inventory | Inventory-heavy or growing companies with reporting discipline |
| Supply-chain finance / reverse factoring | About 1% to 2.5% per month, plus processing fees of 0.5% to 2% | Days to weeks | Underwritten on the buyer’s credit, 30 to 120 day tenor | Suppliers to large, credit-strong buyers |
| Trade credit | 0% if paid on terms; imputed cost is the supplier margin you leave on the table | Immediate | Purchase order or creditworthiness | Any business that can negotiate terms rather than pay at order |
As the U.S. Small Business Administration notes, SBA 7(a) interest is generally priced at the prime rate plus a lender spread, with maximum spreads generally ranging from 3% to 6.5% over prime depending on loan size.
Two things decide the real number: annualized total cost including fees rather than the headline rate, and availability, meaning what the lender will actually advance after haircuts on aged receivables, customer concentration and inventory it cannot resell. “free cash flow” carries the pricing detail, including what borrowing does to the cash the business keeps.
When to hire a pro for working capital
Bring in outside help when the decision is bigger than the bookkeeping. A bookkeeper records what happened. A CPA handles the tax return. Neither owns the forward-looking layer, which is exactly the layer a working-capital squeeze lives in. These are the cases that justify a CFO-level engagement:
- Payroll or tax risk. Any week where payroll or a payroll deposit is in question is a same-week problem, not a next-quarter project.
- A lender declined you, or approved far less than you asked for. Usually the cause is the absence of a credible forecast and a clean borrowing base, not the business itself.
- Covenant pressure. A fixed-charge or leverage test coming due inside two quarters needs a modeled path, and a conversation with the bank before the test, not after.
- Growth above 25% a year, where each new dollar of revenue consumes cash faster than it returns it.
- Complex inventory or receivables: consignment, retainage, deferred revenue, multi-entity, or a customer at 30% of the aging.
- M&A or a raise, where a working-capital peg at closing can move the purchase price by hundreds of thousands of dollars.
- Unclear runway. If the answer to “what does cash look like in 90 days?” takes more than 30 seconds, that is the gap.
Ask any adviser three questions: Will you show me a 13-week cash and working-capital view rather than a monthly report? Will you give me margin by customer? What are the three profit or cash actions you would take in the first 90 days, and how would we measure them?
I work with founder- and CEO-led companies between roughly $5 million and $50 million in revenue that have usable books and no full-time CFO. The CFO Decision Diagnostic is a 10-business-day engagement that delivers that 13-week cash and working-capital view, a margin and profitability map, and a prioritized 90-day CFO action plan, and every ongoing plan carries the same commitment: at least $50,000 in profit opportunities in the first 30 days, or the work is free.
If cash is the constraint on your next decision, tell me what decision you are facing and we can determine in 15 minutes whether a diagnostic is the right next step.
Frequently Asked Questions
What are three examples of working capital?
Cash in the operating account, accounts receivable from customers on net 30 terms, and inventory on the shelf are the three most common current assets in the calculation. Against them sit payables, accrued payroll and accrued taxes. A distributor with $620,000 in receivables and $460,000 in inventory has more than $1 million of funding committed to those two lines alone.
Is negative working capital always a warning sign?
No. Businesses that collect before they pay can run safely below zero: subscription companies billing annually in advance, retailers collecting at the register while paying suppliers on net 45, and service firms taking deposits. The danger is negative working capital caused by short-term debt funding long-term assets or by payables stretched past terms. The test is whether the negative balance comes from customer prepayments or from unpaid bills.
How much working capital does a growing business need?
Multiply your daily cost of sales by your cash conversion cycle, then add one payroll period and a quarter’s tax accruals as a buffer. At $22,000 of daily cost and a 69-day cycle, that is roughly $1.5 million in the cycle plus the buffer. Growth scales the number directly: a 25% revenue increase at the same cycle length needs about 25% more funding.
What is a healthy current ratio for a small business?
Between 1.2 and 2.0 is the range most lenders expect, but the number means little on its own. A 1.8 ratio built on 90-day receivables and dead stock is weaker than a 1.1 ratio built on cash and fast-turning inventory. Check the ratio against the aging schedule and inventory turns before drawing a conclusion.
What are five rules of cash flow?
Cash is a date, not a total, so always forecast by week. Increases in receivables and inventory are uses of cash. Profit is an opinion about timing and cash is a fact. Never let a single customer hold more than about 20% of your aging without a credit limit. Set a minimum-cash floor in dollars and treat breaching it as a decision, not a surprise.
What’s the best cash flow management software?
The right tool depends less on the feature list than on your data. Look for a direct accounting integration, receivable and payable detail at the invoice level, inventory data if you carry stock, bank connectivity, scenario capability and borrowing-base reporting if you have a facility. Dedicated forecasting tools commonly run about $30 to $150 per month, and many accounting platforms include a basic forecast. A forecast inherits every error in the books, so clean the ledger first.
What lender documents are needed for a working-capital facility?
Expect three years of financials plus interim statements, a current receivables aging with customer detail, a payables aging, an inventory listing by category, a 13-week cash forecast, a 12-month projection, tax returns, and a debt schedule. Asset-based facilities add a borrowing-base certificate, usually monthly. Having those assembled before the first meeting changes both the speed and the size of the offer.
How should working capital be analyzed before buying or selling a business?
Buyers set a working-capital peg, normally the trailing twelve-month average of non-cash working capital, and adjust the purchase price at closing for any difference. Pull aged receivables, obsolete inventory, customer deposits and deferred revenue out before you accept a target, because each one can shift the adjustment materially. Seasonal businesses should insist the peg reflect the closing month rather than an annual average.
How do small businesses manage cash flow?
The ones that do it well run three routines: a weekly cash meeting off a 13-week view, a collections call list worked by one accountable person, and a monthly close finished within ten business days so the numbers are still actionable. Add a minimum-cash floor and a rolling update of the forecast each Monday. The habit matters more than the tool.
What do you mean by cash flow management?
Cash flow management is the routine of planning and controlling when money arrives and when it leaves, which is a separate job from measuring profit. In practice it is a weekly cash view, a collections cadence with one accountable owner, supplier payment dates chosen on purpose, and a minimum-cash floor stated in dollars. Working capital is the balance-sheet side of the same job: a company collecting at net 60 while paying suppliers at net 15 is funding 45 days of its own operations, and only the cash side of that shows up in the bank.