
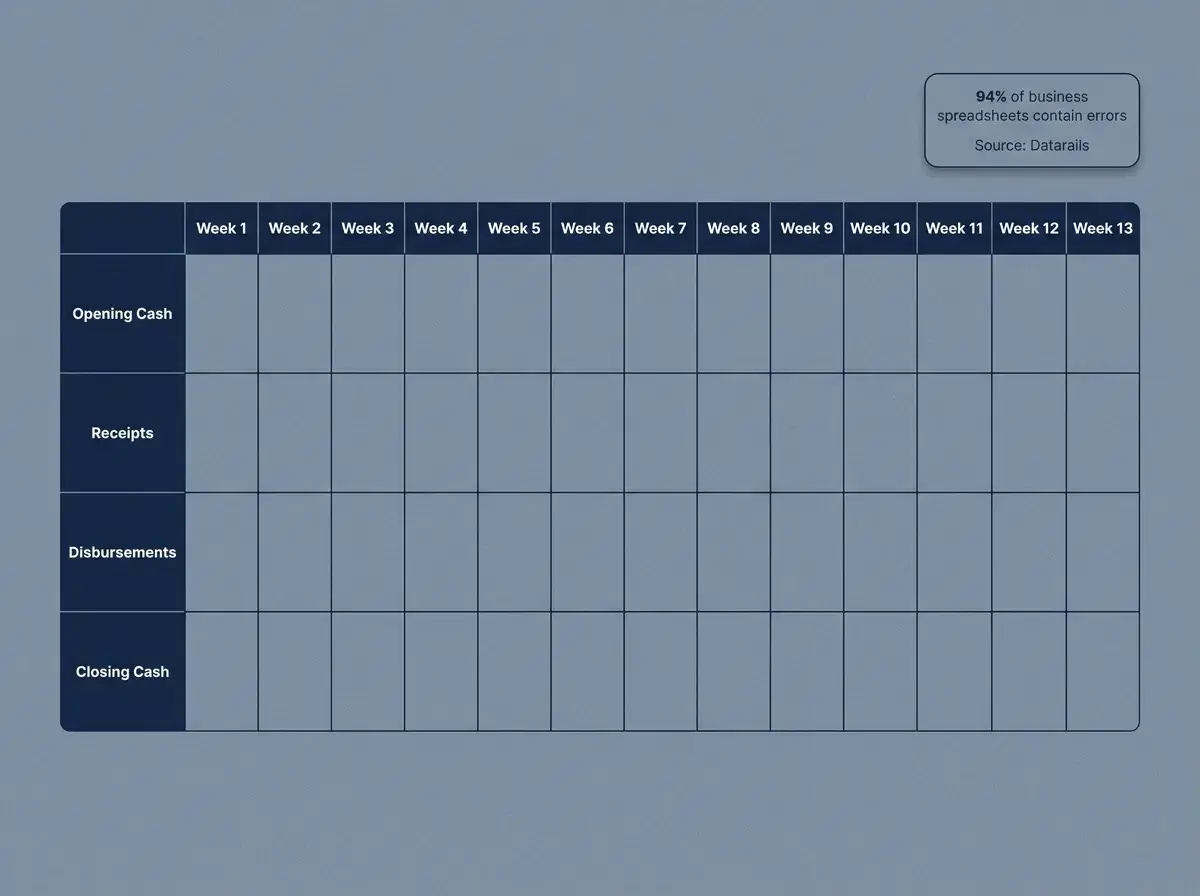
A 13-week cash flow forecast is a rolling weekly projection of the cash actually entering and leaving your bank accounts over the next 90 days. Each week shows opening cash, expected receipts, expected disbursements and a closing balance. It tracks timing, not accounting recognition. Founders, CFOs, lenders and boards use it to see a shortfall before it arrives.

What a 13-Week Cash Flow Forecast Is
The model answers one question: will there be enough cash in the account on the day an obligation comes due. A regular cash flow forecast often runs in monthly or annual buckets and blends estimates across long periods. The 13-week version runs week by week, uses transaction-level detail, and gets rebuilt with actual bank data every week.
Anyone running a founder-led company with real weekly cash swings needs to know this one. That means agencies with client retainers landing on different dates, distributors buying inventory ahead of demand, call centers making payroll every two weeks, SaaS businesses with annual renewals stacked into a few months.
Thirteen weeks is a convention, not a rule. Some companies in real distress run a daily model. Some run 26 or 52 weeks for planning. Thirteen sits at the point where the assumptions are still credible and the horizon is still long enough to show a funding gap with time to react.
How a Rolling 13-Week Forecast Works
The mechanism is simple arithmetic repeated thirteen times. Opening cash balance, plus projected receipts, minus projected disbursements, equals closing cash balance. That closing balance becomes the next week’s opening balance, and the chain runs out 90 days.
The rolling part is what makes it work. When week 1 closes, you replace forecast with actual, drop that week off the front, and add a new week 14 at the back. The horizon stays constant at 13 weeks and never goes stale. A static forecast built once in January is a museum piece by March.
Most 13-week models use the direct method: you forecast named receipts and named payments. Customer X pays invoice 4412 in week 3. Payroll funds Thursday of week 2. The indirect method starts with accounting profit and adjusts for non-cash items and working-capital movement, which is fine for annual planning and useless for deciding whether Friday’s payroll clears. The full mechanics of the indirect method sit in “How to Calculate the Operating Cash Flow Formula.”
The other half of the routine is variance analysis. Each week, actual receipts and payments replace the forecast amounts in the week that just closed, and you set the prior forecast next to what hit the bank and explain the difference line by line: collections by customer, payroll, tax remittances, vendor payments and any draw. That review is the operating discipline behind the model, with one named owner, a fixed weekly deadline and assumptions revised in the same meeting. Receipts short by $80,000 because two clients slipped. Disbursements under by $22,000 because a supplier invoice arrived late. Weeks 1 and 2 should land close to exact. By weeks 4 and 5, total variance usually ends up relatively low. Sometimes it doesn’t, and that tells you something too.
What Goes Into the Model
Check your spreadsheet against this list. If a column is missing, the closing balance is wrong. AR and AP aging are starting points rather than answers: every open invoice has to be moved into the week cash actually lands or actually leaves, and each payable needs a stage attached, since an invoice received but not approved pays later than one already scheduled for release. Payroll taxes, sales and income tax remittances, debt service and borrowing-base limits each run on their own calendar and belong on separate lines.
- Verified bank balances by account, with restricted cash and merchant reserves shown separately so they aren’t counted as spendable.
- AR aging converted to expected collection weeks, not invoice due dates.
- AP aging with your actual payment behavior, not vendor terms.
- Payroll and employer taxes, split by funding date rather than accrual date.
- Sales tax, payroll tax remittances and estimated income tax on their filing calendar.
- Debt service, principal and interest, plus any covenant test dates.
- Capex and one-time items: annual insurance premiums, bonuses, legal fees, severance.
- Financing assumptions, including line availability tested against borrowing-base limits, not the stated facility size.
Watch the spreadsheet itself. 94% of business spreadsheets contain errors, according to Datarails. Lock the formulas and have a second person trace the closing balance back to a bank statement before anyone makes a decision on it.
When a 13-Week Forecast Matters
Weekly visibility changes decisions when the margin for error is thin. The trigger situations are consistent: your cash buffer covers fewer than two payroll cycles, customer collections have slipped past historical patterns, a lender wants weekly liquidity reporting, a covenant test is approaching, growth is consuming cash faster than it produces it, or you are heading into a restructuring conversation with suppliers. PE-backed portfolio companies and businesses in a turnaround usually run the model every week as a standing requirement, because the sponsor, the lender or the restructuring adviser wants weekly evidence that obligations can be met and that any revolver draw sits inside the borrowing base.
Profitable companies land here constantly. Profit says the work was worth doing. It says nothing about whether the money shows up before the obligation does. The gap between those two is exactly where the 13-week model lives, and “What Is a Cash Flow Statement? A Simple Guide” covers why the accounting view and the bank view diverge.
Example: a $14M marketing agency
Opening cash in week 1 is $620,000. The minimum cash balance, set at one payroll cycle plus debt service, is $450,000.
Three client retainers totaling $340,000 were billed on net-30 terms and forecast to land in week 4. Two of the three clients have paid in 45 to 52 days for the last four quarters. Put them where history says they pay, week 6, and week 4 receipts fall to $118,000.
Week 4 also carries payroll of $290,000, a quarterly payroll tax remittance of $96,000, and media buys of $210,000 placed on behalf of those same clients.
Closing cash in week 4 drops to $142,000. Under the floor by $308,000, three weeks before it happens.
Nothing in the P&L showed this. Revenue was recognized on billing. The agency was profitable the entire time. The model showed it because it used the payment behavior, not the invoice terms.
That agency now has three weeks to act instead of three days. It earned that lead time two ways: each retainer sits in the week history says the client pays rather than the week the invoice says it is due, and the closing balance gets measured against a stated cash floor rather than against zero. It can hold the media buy until the retainers clear, ask for deposits on the next cycle, or draw on a line it already has documented. As Graphite Financial notes, the 6 to 8 week visibility window is what lets leaders act before a shortfall arrives rather than after.
This is the same view I build as a 13-week cash and working-capital deliverable inside the CFO Decision Diagnostic. If you want a second set of eyes on where your own weekly balance goes underwater, a 15-minute call is usually enough to tell whether the model is worth building.
Why Weekly Timing Beats Monthly Thinking
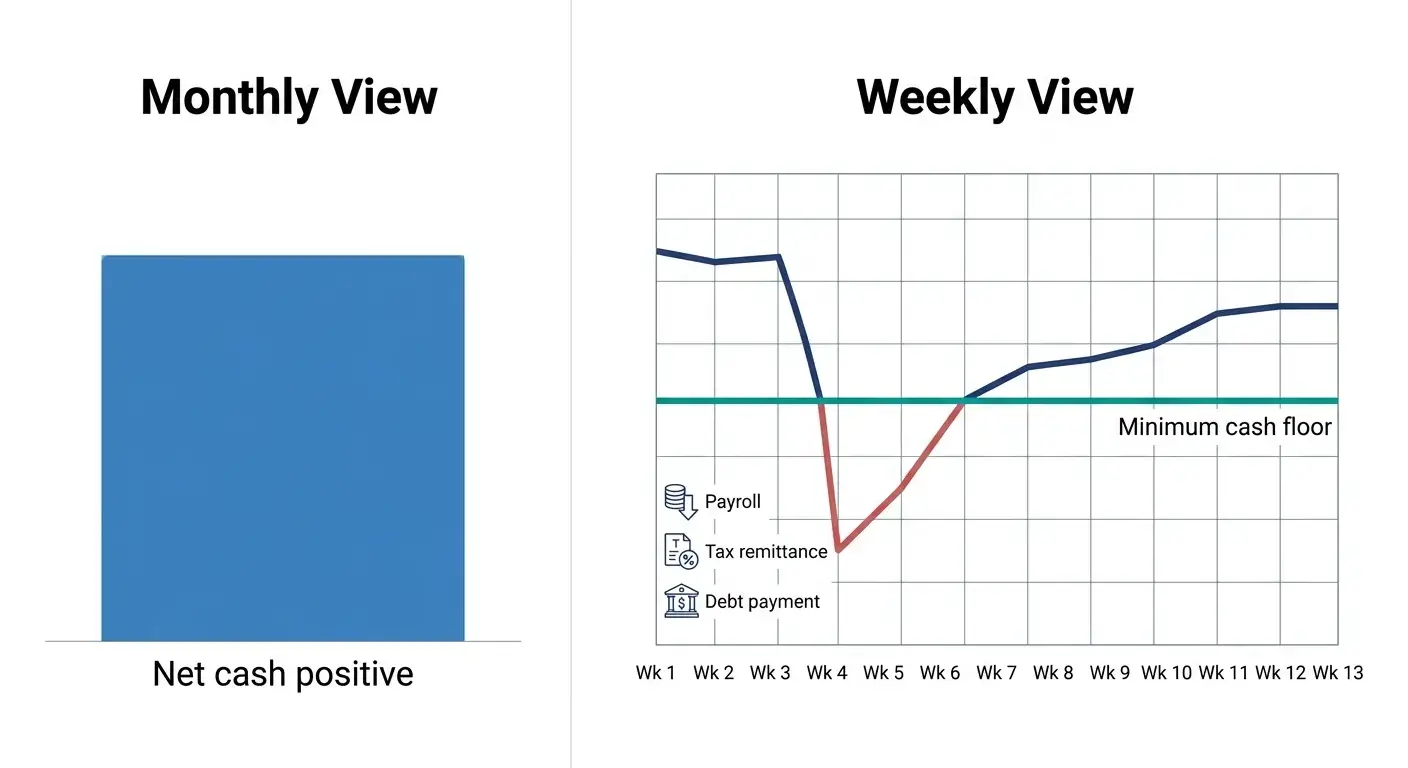
A month hides the days that matter. A monthly forecast showing $200,000 of net cash generation can still contain a Tuesday where payroll, a tax remittance and a debt payment all fund within 48 hours and the account goes negative.
Weekly periods put the dates on the page. Payroll funds on specific days. Sales tax is due on a specific day. Supplier checks clear two or three days after you release them, and ACH settlement adds another day or two. Card-processing deposits arrive net of fees and sometimes net of a reserve. Build the model in weeks and those settlement gaps show up as real numbers. Build it in months and they disappear into an average.
What to Do Next if You Need One
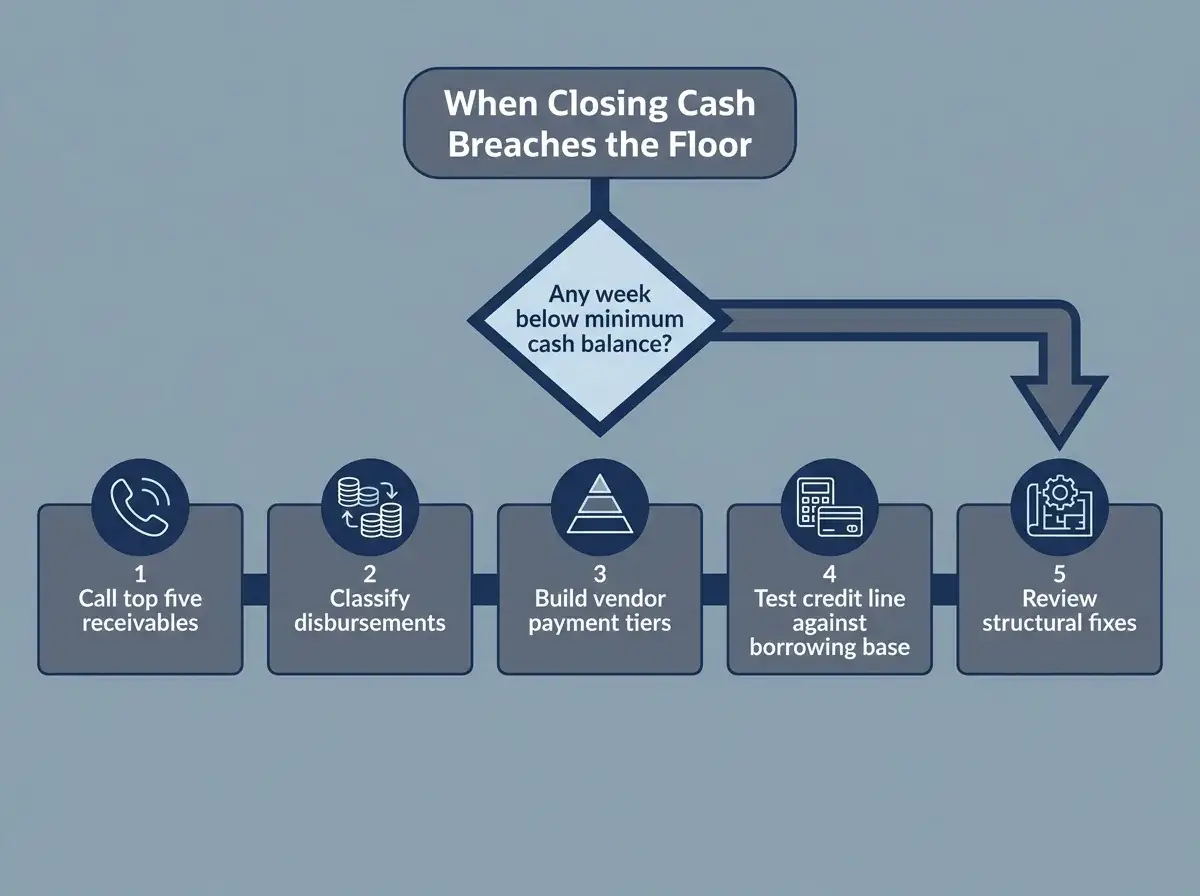
The decision in front of you is who owns the model and how fast you need it. When projected closing cash falls below your minimum cash balance in any week inside the horizon, that is the trigger. Not when it goes negative. The floor should equal your fixed committed obligations in the worst single week of the next month, usually one full payroll plus employer taxes plus debt service, with a safety margin sized to how volatile your collections actually are.
Once a week breaches the floor, work the actions in order of speed and cost:
- Call the top five receivables. Fastest move, no cost, gets a real promised date rather than an aging bucket.
- Reclassify disbursements into committed, probable and discretionary. Committed means payroll, taxes, debt, insurance. Discretionary spend can move a week with one email.
- Build a vendor payment tier before you need it. Tier 1 is supply-critical and gets paid on time. Tier 2 takes a partial payment with a call. Tier 3 waits. Call Tier 2 and 3 before the due date, never after.
- Test the credit line for real. Check the borrowing base, the covenant test and the documentation. A facility you cannot draw is not cash.
- Then look at structure. Deposits, shorter terms, milestone billing. “Cash Flow Problems: What’s Causing It and How to Fix It” covers the structural repairs in depth.
Build it in-house if you have a controller who can own a Monday deadline and run the variance review. Bring in help when cash is already tight, when a lender is asking for weekly reporting, or when nobody inside the company owns the forward-looking layer. The controller reports what happened and the CPA handles the return. Neither seat answers what cash looks like in 90 days.
The model only works when someone owns the weekly follow-through. A meeting where variances get explained, assumptions get revised and a name goes next to each action is liquidity control. At 800 Travel Systems I ran daily KPIs on staffing versus schedule, call-abandon, conversion and gross profit by agent, and putting travel insurance on every ticket lifted close rates from 10% to 12%. The numbers moved because someone owned them on a fixed schedule.
What a build or an outside engagement runs, and which financing options fit, sits in “Working Capital Guide: Costs, Options and When to Hire.”
If your books are current and you still cannot say what cash looks like 90 days out, start with a 15-minute call.
Frequently Asked Questions
Is a 13-week cash flow forecast the same as a cash flow statement?
No. A cash flow statement is a historical report explaining what already happened to cash across operating, investing and financing activities. A 13-week forecast is a forward-looking weekly schedule of expected bank activity, usually built on the direct method with named receipts and payments. One closes the books, the other protects payroll.
| Term | Direction | Period | Primary use |
|---|---|---|---|
| 13-week cash flow forecast | Forward | Weekly, rolling 90 days | Near-term liquidity control |
| Cash flow statement | Backward | Monthly, quarterly, annual | Reporting what happened |
| Cash budget | Forward | Usually monthly, fixed | Planning against a target |
| 12-month forecast | Forward | Monthly | Strategy, hiring, capex, financing |
How do you forecast customer collections in a 13-week model?
Use historical payment behavior per customer, not the invoice due date. Pull the last four to six payments for each major account and calculate the average days from invoice to cash in bank. A client on net-30 who has averaged 48 days goes in week 7, not week 5. Apply a collection rate to older buckets too, since invoices past 90 days often collect at a materially lower rate than current ones.
Should I use invoice due dates, payment dates, or the date cash reaches the bank?
The date cash reaches the bank, every time. Add a one to two business day settlement buffer for ACH, two to three days for mailed checks, and account for card settlements arriving net of processing fees. If a payment date lands on a weekend or a bank holiday, push it to the next business day in the model.
How do lenders and restructuring advisers use a 13-week cash flow forecast?
They use it as evidence that management can meet obligations as they fall due. Lenders typically request the model weekly during covenant stress, compare forecast to actual, and watch the variance trend more closely than the absolute numbers. A model that misses by 30% two weeks running costs you credibility faster than a tight week does.
Should a business use a 13-week forecast, a 12-month forecast, or both?
Both, for different jobs. The 13-week view controls liquidity and answers questions about payroll, taxes and supplier payments. The 12-month view answers capacity, hiring, capex, debt maturity and capital structure questions that a 90-day window cannot see. Running only the short model leaves you managing week to week with no strategic direction.
What is the difference between a 13-week cash flow forecast and a cash budget?
A cash budget is usually a fixed monthly plan built next to the annual budget and compared with actuals after the month closes. A 13-week forecast is a rolling weekly schedule of expected bank activity that gets rebuilt with actual cash every week. The budget tells you whether you hit the plan, the 13-week view tells you whether Friday’s payroll funds. Companies running both use the budget for targets and the 13-week model for decisions inside the next 90 days.
Can you provide a free 13-week cash flow forecast template for Excel?
I don’t distribute templates, and most free ones create a different problem: they give you thirteen clean columns and no method for converting AR aging into realistic collection weeks. The structure is straightforward enough to build yourself using the input list in this article. The work that determines whether the model is right sits in the assumptions, not the spreadsheet layout.
Why does my 13-week forecast never match the bank balance?
Run a reconciliation checklist before assuming the formulas are wrong. The usual culprits are uncleared checks, ACH still in transit, transfers between accounts counted twice, restricted cash or merchant reserves included as available, and card deposits booked gross when they arrive net of fees. Trace one week’s closing forecast balance line by line to the actual statement, and the gap almost always resolves into two or three of those items.