
Most owners I meet can tell me last month’s revenue to the dollar and have no idea what their bank balance looks like eight weeks out. That gap is where payroll surprises live. A cash flow forecast closes it, and it takes less machinery than most people assume.

What a cash flow forecast is
A cash flow forecast is a forward-looking schedule of the money you expect to enter and leave your bank account over a set period, built week by week or month by month. It starts with the cash you hold today, adds expected receipts, subtracts expected payments, and produces a projected closing balance for every period in the horizon.
Any founder or CEO who signs payroll, carries debt, or waits on customer payments needs to read one, whether or not they build it themselves.
A useful forecast answers three questions that the income statement cannot:
- Will there be cash in the account on the day each obligation comes due?
- How many weeks of runway sit between today and the next funding or collection event?
- Which decision, a hire, an inventory buy, a distribution, actually fits inside the cash the business will hold?
It gets confused with three other documents. Here is how they separate.
| Document | Direction | Answers | Where the full breakdown lives |
|---|---|---|---|
| Cash flow forecast | Forward | Will cash be there when bills fall due? | This article |
| Budget | Forward | Can we afford the year and the plan? | Set annually, measured as a benchmark |
| Cash flow statement | Backward | Where did last period’s cash actually go? | “What Is a Cash Flow Statement? A Simple Guide” |
| Free cash flow | Backward or forward | What’s left after reinvestment? | “What Is Free Cash Flow? A Plain-English Guide” |
The short version on the budget question: a budget records income when you plan to earn it, and a forecast records it on the date you expect the money to clear the bank. A company can beat its budget for the year and still come up short on a Thursday in March.
How a cash flow forecast works
The mechanism is one line of arithmetic repeated across periods: opening cash balance, plus expected cash inflows, minus expected cash outflows, equals the closing balance, which then becomes the opening balance of the next period. Every week or month chains to the one before it. An error in week one travels through the entire model.
The terms a CFO or a lender will use:
Cash inflow and cash outflow. Money crossing the bank account, dated when it clears, not when it was invoiced or accrued.
Direct method. You list actual scheduled receipts and payments line by line from open invoices, payroll runs, supplier bills, tax due dates and debt schedules. This is what short-horizon forecasts use, and it’s what a bank expects to see.
Indirect method. You start with projected net income and adjust for non-cash items, working capital movements, capital expenditure and debt service. It’s the right tool for a twelve-month cash flow forecast model tied to the P&L. It’s the wrong tool for asking whether Friday’s payroll clears.
Rolling forecast. As each week closes, actuals replace assumptions and a new week is added at the far end. The horizon stays constant instead of shrinking.
Timing is the whole game. An invoice dated the 3rd on Net 45 terms is not cash on the 3rd, and often not cash on day 45 either. Roughly half of business-to-business invoice value in the United States gets paid after the stated due date. A forecast that plugs in contractual due dates rather than observed payment behavior will read as solvent right up to the week it isn’t.
What goes into the forecast
Everything that touches the bank account, including the items that never appear on the income statement.
Inflows: – Customer collections, dated by expected payment behavior rather than invoice date – Retainer and subscription draws, including failed-card retries – Deposits, milestone payments and retainage releases – Loan or line-of-credit draws, equity injections, owner contributions – Tax refunds, rebates, asset sales
Outflows: – Payroll by run date, usually every two weeks, plus payroll taxes and benefit remittances – Supplier and subcontractor payments on their real settlement dates – Rent, software, insurance premiums, merchant fees – According to Internal Revenue Service, federal estimated tax payments, which for calendar-year filers fall on April 15, June 15, September 15 and January 15. – Debt service split into interest and principal, since only interest hits the P&L – Capital expenditure, inventory buys and prepayments – Owner distributions and draws
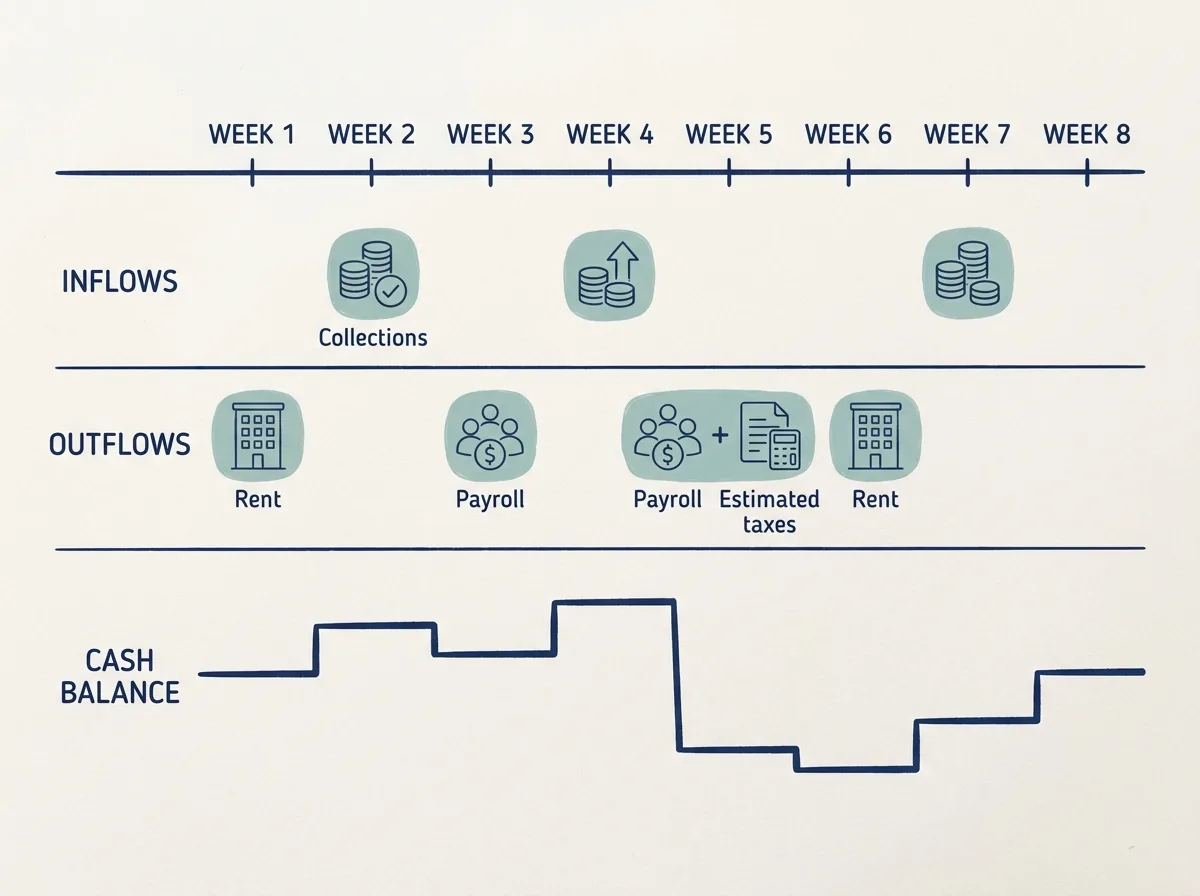
Irregular items are where most forecasts break. Annual insurance, bonus cycles, software renewals and quarterly taxes should sit in the exact week the money leaves, with a sinking-fund line accruing toward them so the hit isn’t a surprise.
When a cash flow forecast matters
It matters in any week where an obligation and a receipt are scheduled to cross. Profitable companies run out of cash for a timing reason, almost never for a profitability reason. The forecast is the only document that shows the crossing before it happens.
The recurring situations:
- A large customer stretches terms. One 45-day client drifting to 68 days on a six-figure invoice moves the shortfall from a rounding error to a payroll event.
- Payroll and tax dates collide. Two payroll runs and a quarterly estimate in the same week create a spike no monthly view will show.
- Seasonality. Inventory is bought months before the receipts arrive. The trough is deeper than the annual margin suggests.
- Hiring. A $140,000 hire costs cash on day one and produces margin in month four or later. The forecast prices the gap.
- Debt and covenants. Principal amortization consumes cash that never shows up as expense.
- Runway checks. How many weeks before the balance touches your minimum operating cash threshold, often set at $250,000 or one full payroll cycle plus a month of fixed costs.
Example: a marketing agency at $14M revenue
Opening cash, start of week 5: $410,000. Expected receipts, weeks 5 through 7: $940,000, including a $340,000 invoice to the largest client on Net 45. Scheduled outflows, weeks 5 through 7: two payroll runs at $260,000 each, media vendor prepayments of $300,000, rent and software of $90,000, a $75,000 federal estimate. The P&L for the quarter shows a 9% net margin. Nothing is wrong with the business.
The large client pays on day 68 instead of day 45. Actual receipts land at $600,000. Closing cash, end of week 7: $25,000, against a week 8 payroll of $260,000.
The month was profitable. The account still went to the floor, and the owner found out on a Tuesday instead of five weeks earlier.
This is why I push clients toward a short weekly view before anything else. A 13-week cash view is a rolling picture of money in and out, and once someone owns it, an owner answers “what does cash look like in 90 days?” in about 30 seconds. Lenders respond to the same discipline. At CertiPay, where I served as CFO of a $285M PEO, ASO and B2B payroll software business, meeting bank reporting requirements inside 180 days unlocked a 2X credit line.
If the timing picture in your own numbers is fuzzy right now, a 15-minute call is usually enough to tell whether the issue is collections, terms, or the structure of the forecast itself.
What to do next with your forecast
Update weekly if you have debt, payroll every two weeks, or customers past 45 days. Monthly updates are fine only for businesses with subscription receipts, no principal amortization and cash above two payroll cycles. Yes to taxes, loan principal, owner draws and capital expenditure. All of them, at full amount, on the date the bank clears them. Leaving principal or distributions out is the single most common way a forecast overstates available cash.
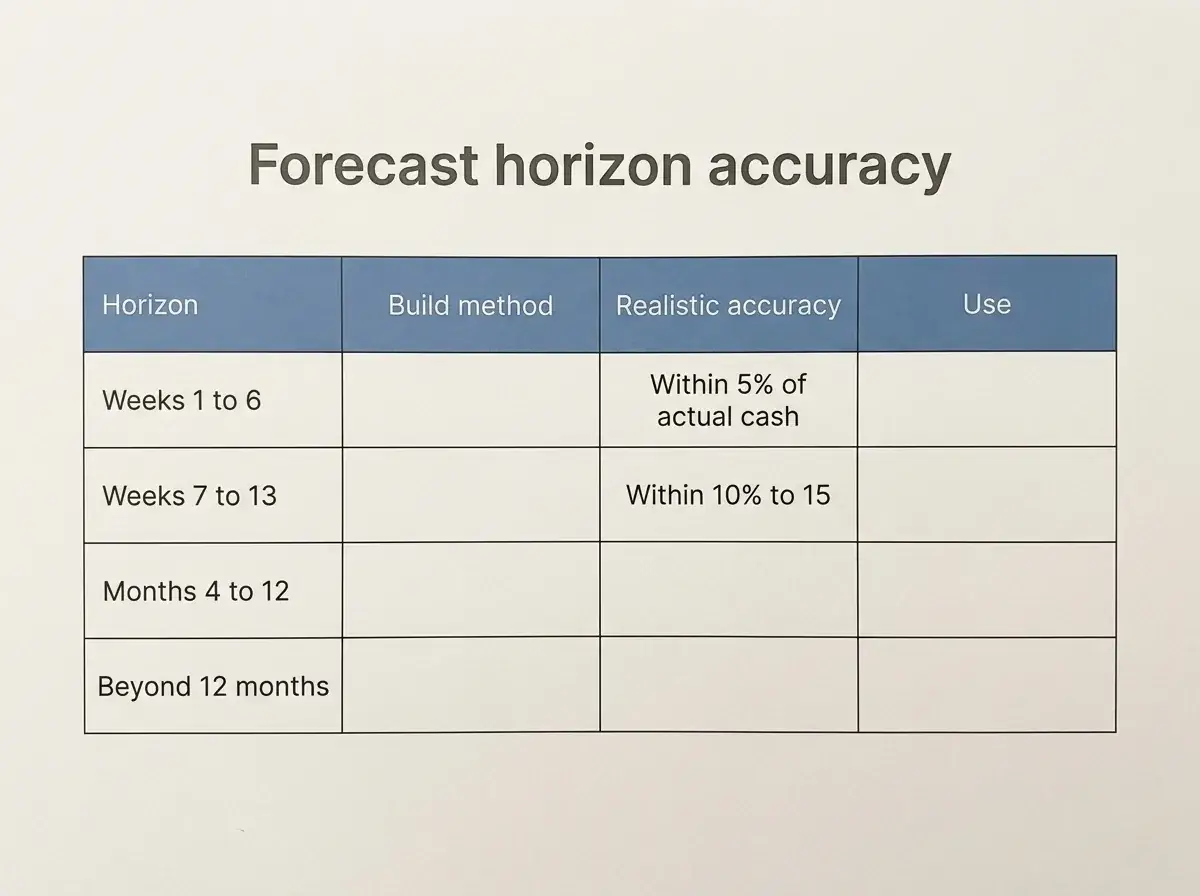
On horizon and reliability, accuracy decays fast and unevenly:
| Horizon | Build method | Realistic accuracy | Use |
|---|---|---|---|
| Weeks 1 to 6 | Direct, invoice by invoice | Within 5% of actual cash | Payment decisions, payroll timing |
| Weeks 7 to 13 | Direct, with collection-behavior assumptions | Within 10% to 15% | Hiring, credit line sizing, vendor terms |
| Months 4 to 12 | Indirect, driven off the P&L | Directional only | Capital planning, covenant headroom |
| Beyond 12 months | Scenario ranges | Not a forecast | Strategy, not cash management |
Track actual against forecast every week by line, not in total, since a receipts overstatement and a payables understatement can cancel out and hide both. When any single category misses by more than 10% for two consecutive weeks, the assumption is broken and needs rebuilding, not nudging.
On tooling, the test is not features. Stay in a spreadsheet when you have one entity, fewer than about 150 open invoices, and one person who reconciles to the bank weekly. Move to a forecasting platform when you run multiple entities or bank accounts, when the weekly rebuild takes more than three hours, or when receivable volume makes manual dating unreliable. The accounting system alone rarely suffices. It dates cash off invoice terms rather than customer behavior.
Every version reconciles to the bank before it gets used. Book cash and bank cash differ by uncleared checks, deposits in transit and duplicated imports. A forecast that doesn’t tie to the statement balance loses its credibility with the first person who checks.
Most forecasts also need an owner other than the founder. When I start with a company, weeks 1 and 2 go to reviewing cash, reporting and processes. Weeks 3 through 6 build the forward plan, and weeks 7 through 12 fix the top profit or cash leak and set a review rhythm. A scoped diagnostic that produces a 13-week cash and working-capital view typically plans at $3,000 to $5,000, and the financing side of any gap the forecast reveals, including line sizing and lender options, is covered in “Working Capital Guide: Costs, Options and When to Hire.”
If your books are usable and you’re carrying a real decision on cash, margin or growth, start with a short conversation about what the next 90 days actually look like.
Frequently Asked Questions
What is a 3-way cashflow forecast?
A 3-way forecast links the profit and loss statement, the balance sheet and the cash flow forecast so that they drive each other. Revenue assumptions feed receivables, receivables feed collections, and collections feed the closing cash balance, with the balance sheet acting as the check that the model balances. Lenders and acquirers ask for three-way models on horizons of twelve months or more. Weekly liquidity management stays on a direct forecast.
How do you forecast customer receipts when invoices may be paid late?
Use observed days-to-pay by customer, not contract terms. Pull the last twelve months of payment history, calculate each significant customer’s average lag, and date the forecast on that number. A Net 30 client who consistently pays in 52 days gets dated at 52. For customers with no history, add 15 days to terms and split large invoices into a partial-payment assumption, such as 70% on the expected date and 30% two weeks later.
What does a negative forecast ending balance mean?
It means that on current assumptions, scheduled payments exceed available cash in that period and something has to move. The responses, in the order I usually work them: accelerate collections on the largest overdue invoices, defer discretionary spend and capital expenditure, sequence vendor payments behind payroll and taxes, then draw on a line of credit. A projected deficit six weeks out is a planning item. The same deficit six days out is an emergency.
Why does my spreadsheet show cash when my bank balance is lower?
Almost always one of four things: uncleared checks that left the ledger but not the account, deposits recorded on the invoice date instead of the settlement date, duplicated bank feed imports, or direct debits that were never entered. Reconcile the opening balance to the bank statement before every update. An opening cash error repeats in all thirteen weeks that follow.
How do I forecast money from sales that haven’t happened yet?
Separate the columns. Contracted work with a signed order goes in at full value on its expected collection date. Pipeline goes in probability-weighted by stage. I’d cap anything below a verbal commitment at zero for the first six weeks. Keeping “certain cash” and “hope cash” in different columns prevents the most common failure in a cash flow forecast example built by an optimistic founder.
How can a cash flow forecast help a startup calculate runway?
Runway comes out of the forecast directly: find the first week where the projected closing balance crosses your minimum operating threshold, then count the weeks from today. The forecast version beats the simple cash-divided-by-burn calculation because it places annual insurance, tax payments and debt principal in real weeks, which typically pulls the crossing point three to six weeks earlier than the averaged math suggests.
What is the difference between a cash flow forecast and a profit-and-loss forecast?
A P&L forecast projects revenue earned and expenses incurred under accrual rules, including non-cash items like depreciation. A cash flow forecast projects bank movements only, so depreciation drops out entirely while loan principal, owner draws and equipment purchases come in. The two can point in opposite directions in the same month, which is exactly why both get built. As NC Office of State Budget and Management notes, North Carolina’s May 2026 revised consensus General Fund revenue forecast anticipated overcollections of $979 million in FY 2025-26.