
You check the dashboard. Utilization is sitting at 78%. Your team looks busy. The calendars are full. Yet when you open your P&L, the story doesn’t match. Gross margin is stuck at 42%. Net profit in the single digits. Something isn’t adding up.
This is the paradox many agency leaders face. You’ve been sold the idea that high utilization equals success. So you push your team harder. You fill every hour. You celebrate when that percentage climbs. Then you wonder why profitability never follows. The answer isn’t that your team isn’t working hard enough. It’s that utilization, by itself, tells you almost nothing about whether you’re making money.
In reality, utilization measures how busy your people are. Margin measures whether that busyness is worth anything. Those two numbers can move in opposite directions, and often do. A fractional CFO’s job is to figure out why.

The Utilization-Margin Paradox: Why Your Team Looks Busy but Your P&L Doesn’t
Let’s start with a scenario. You run a creative agency. Your producers are clocking 80% billable hours. That should be healthy, right? Industry benchmarks say 75–85% is the sweet spot. But your gross margin is under 45%, and your net margin is 9%. You’re working weekends. Your team looks exhausted. And the bank account isn’t growing.
What’s happening is pure math. You’re confusing activity with value. Your utilization number counts every hour logged as billable. But it doesn’t ask: Did you actually bill those hours? Did the client pay? Was the rate high enough to cover the fully-loaded cost of that person plus overhead? Did you write off half the project because the scope exploded?
This is where most agencies break down. They manage to a single number and assume the rest takes care of itself. It doesn’t. Utilization is a helpful input metric. But it’s not a profit metric. Agencies that treat it as one end up busy, burned out, and broke.
Mistake #1: Confusing Utilization with Realization Rate
Utilization tells you what percentage of time is logged to client work. Realization tells you what percentage of that time actually turned into revenue. They are not the same thing.
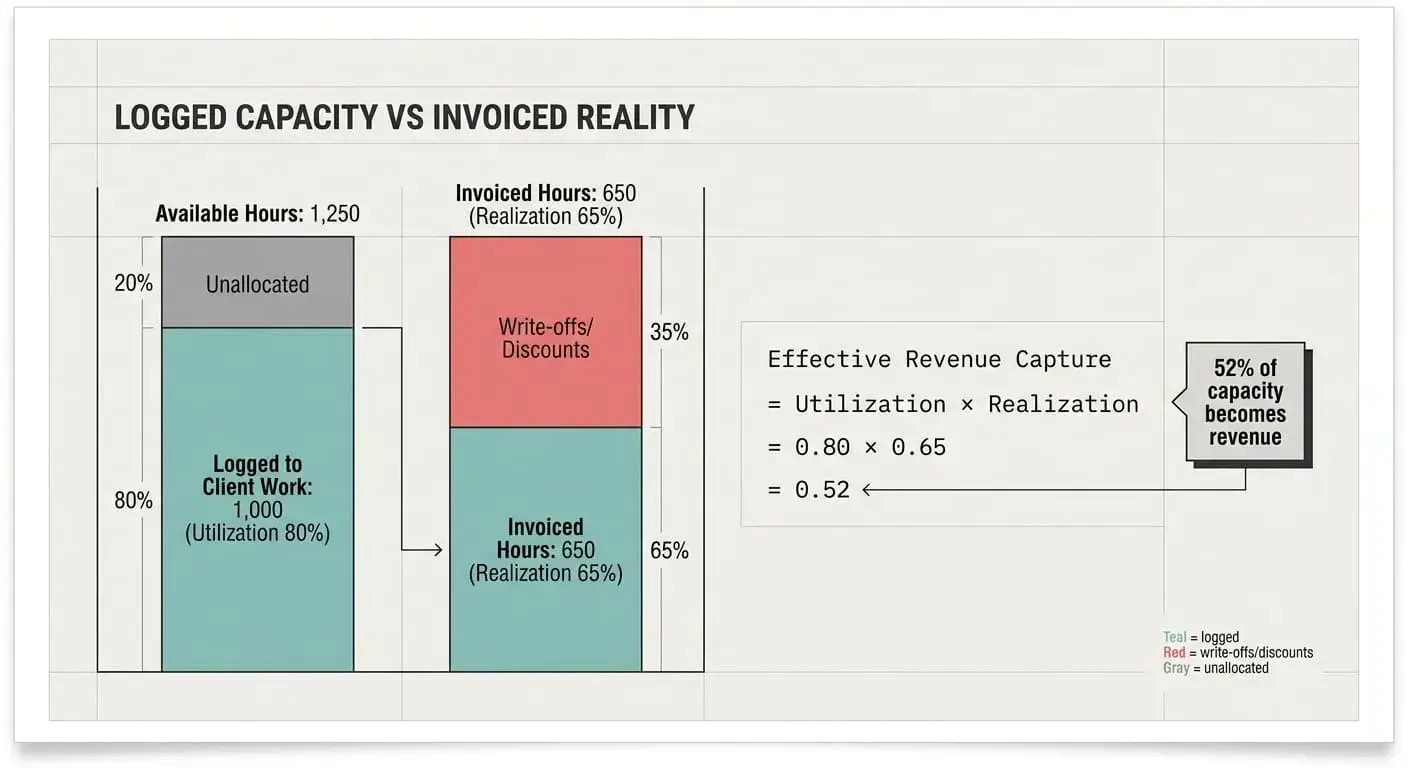
Let’s say your team logs 1,000 billable hours in a month. Your utilization looks strong at 80%. But after scope creep, discounts, and write-offs, you only invoice 650 of those hours. Your realization rate is 65%. You thought you had 80% productivity. In reality, you captured 52% of available capacity as revenue.
This gap is where profitability dies. You’re paying salaries, benefits, and overhead for 100% of the time. You’re billing for half. The difference comes out of margin.
Realization Rate Definition:
Realization rate is the percentage of logged hours that are actually invoiced and collected. It’s calculated as billed revenue divided by the value of hours logged at standard rates. Below 85%, you have a pricing, scoping, or collection problem.
How Write-Offs Erode Margin Without Lowering Utilization
Write-offs are silent margin killers. They happen when you log hours to a project but never bill them. Maybe the scope expanded. Maybe the client pushed back. Maybe you underestimated the work and absorbed the overage to preserve the relationship.
From a utilization standpoint, those hours still count. Your producer was busy. The spreadsheet shows 80% billable. But from a margin standpoint, those hours are pure cost. You paid the salary. You didn’t collect the revenue.
Common sources of write-offs include:
- Proposal and pitch work that isn’t billable but still takes time.
- Onboarding and ramp-up on new clients when you’re still learning their systems.
- Rework and revisions beyond what the scope allowed.
- Internal meetings and training logged incorrectly as client time.
- Over-servicing to keep a client happy when they complain about cost.
Each of these chips away at realization. And because they happen at the project level, they’re invisible in aggregate reports. You won’t see them until you drill into individual clients and projects.
Realization Rate as the Profit Diagnostic
Realization rate is the metric that connects utilization to margin. If your realization is strong (above 85%), your utilization percentage is a decent proxy for revenue. If your realization is weak, your utilization number is misleading.
To calculate realization rate monthly:
- Take total billable hours logged across the team.
- Multiply by your standard or blended billable rate.
- Compare that to actual revenue invoiced for the same period.
- Realization = (Invoiced Revenue / Standard Rate × Hours Logged) × 100.
Track this by project, by client, and by service line. You’ll quickly see which work is profitable and which isn’t. Agencies that monitor realization monthly can intervene before margin collapses. Those that don’t end up explaining to their accountant why a busy quarter produced no profit.
Pro-Tip: Acceptable Realization Rate Thresholds by Service Type
- Retainer services: 90–95% (predictable scope, recurring work).
- Project-based services: 80–90% (some scope variability expected).
- Time-and-materials work: 85–95% (should be high if billed as incurred).
- Fixed-fee outcome work: 70–85% (higher risk of overruns).
If your realization is below these ranges, you have a scoping, pricing, or delivery problem.
Mistake #2: Pushing Utilization Beyond 80% Triggers Hidden Attrition and Burnout Costs
Utilization isn’t a number you maximize. It’s a number you optimize. Pushing producers to 90% or higher might look good on paper, but it destroys profitability over time. Here’s why.
Sustained high utilization leaves no buffer. No time for learning. No time for business development. No time to handle a sick day or a vacation without scrambling. When people operate at maximum capacity for months, they burn out. Quality drops. Mistakes happen. And eventually, they leave.
The cost of that turnover is staggering (you lose institutional knowledge, you lose client relationships, you lose revenue while the seat sits empty). Then you pay recruiting fees, onboarding costs, and months of ramp-up time before the replacement is productive. All of that comes out of margin, and none of it shows up on a utilization report.
The True Cost of Staff Replacement and Ramp Time
Let’s put numbers on it. You have a senior producer earning $90,000 a year. Fully loaded with benefits, payroll taxes, and overhead, that person costs you around $135,000 annually. If they quit, here’s what you pay:
- Recruiting: 15–25% of salary, so $13,500–$22,500 for agency fees or internal recruiting time.
- Onboarding and training: 1–2 months of manager and peer time, worth $10,000–$20,000 in lost productivity.
- Ramp-up period: 3–6 months before the new hire is fully productive. During that time, you’re paying full salary for partial output, a drag of $30,000–$60,000.
- Lost revenue: During the vacancy and ramp, projects slow down or get reallocated, costing $50,000–$100,000 in unrealized billable capacity.
Total replacement cost: $100,000–$200,000 per senior role. If your margin is already thin, losing one or two people in a year can wipe out your profit entirely. And the trigger? Utilization above 85% sustained over six months or more.
Burnout as a Hidden Margin Killer
Burnout doesn’t just cause turnover. It causes performance degradation while people are still employed. Burned-out teams make mistakes. They miss deadlines. They deliver mediocre work. Clients complain. You discount invoices to smooth things over. Realization drops. Margin shrinks.
You also see upticks in sick leave and mental health days. Short-term disability claims. Increased healthcare costs if you’re self-insured. All of these are downstream costs of over-utilization, and they’re hard to track because they show up in random places on the P&L.
A fractional CFO will tell you that healthy utilization leaves room for humans to be human. The ideal range for most producers is 70–80%. That leaves buffer time for training, sales support, internal process improvement, and the inevitable chaos of client work. It also keeps people engaged and loyal, which protects your margin over the long run.
Mistake #3: Ignoring Project-Level Profitability
Your agency-wide utilization might be 75%. Your gross margin might be 50%. Both look fine. But if you drill into individual projects, you’ll often find that 20% of your work drives 80% of your margin, and another 20% is actively losing money.
This is the trap of managing in aggregate. You can’t fix what you can’t see. If your financial systems only report revenue and margin at the company level, you’re flying blind. You don’t know which clients to keep, which services to expand, or which projects to kill.
The Profitability Waterfall: Where Margin Leaks by Project
Every project has a profitability waterfall. It starts with the contracted revenue. Then costs cascade down:
- Direct labor cost: Salary, benefits, and payroll taxes for the hours worked.
- Overhead allocation: A share of rent, software, admin staff, and leadership time.
- Realization hit: The gap between hours logged and hours billed.
- Write-offs and discounts: Hours you absorbed or revenue you gave back.
- Rework and inefficiency: Extra time spent fixing mistakes or managing scope creep.
What’s left at the bottom is project profit. For healthy agencies, that number should be 20–35% of project revenue. If it’s below 10%, the project is subsidized by other work. If it’s negative, you’re paying clients to let you serve them.
You won’t see this in a top-line P&L. You need project-level accounting. You need time tracked to tasks and phases. You need invoices tied to projects and realization calculated per engagement. Most agencies don’t have this. That’s why they’re busy but not profitable.
Fixing ‘Nice-to-Have’ Projects That Destroy Margin
Once you can see project-level margins, you’ll discover work you shouldn’t be doing. Maybe it’s a long-time client who demands discounts because “we’ve been together for years.” Maybe it’s a service line you offer because competitors do, but you’ve never figured out how to deliver it efficiently. Maybe it’s a founder’s pet project that burns hours but generates no revenue.
Fixing this is uncomfortable. It means having hard conversations. It means repricing or exiting work. It means saying no to revenue that looks good on the top line but destroys the bottom line.
Here’s how to approach it:
- Identify the bottom 20% of projects by margin. Calculate their true cost including overhead.
- Determine if repricing is possible. Can you adjust scope or rates to move the project into profitability?
- If not, plan an exit. Give notice. Transition the work. Redeploy your team to higher-margin clients.
- Resist the temptation to fill the gap with more low-margin work. Better to operate at 70% utilization on profitable projects than 85% utilization on break-even work.
This is where a fractional CFO earns their retainer. They quantify the margin drag. They model the impact of exiting low-value work. They give you permission to let go of revenue that’s costing you money.

Mistake #4: Underpricing Relative to Fully-Loaded Labor Costs
You pay your senior strategist $100,000 a year. You bill them at $200 an hour. That feels like a healthy 2x multiplier, right? Wrong.
That $100,000 salary isn’t the full cost. Add benefits, payroll taxes, and overhead, and the fully-loaded cost is closer to $150,000. Divide that by 2,080 annual work hours (assuming full-time), and the loaded cost per hour is $72. Now subtract time off, internal meetings, and admin work, leaving 1,500 billable hours per year. The real cost per billable hour is $100.
If you’re billing at $200, your margin is 50%. That’s acceptable but not great. If you’re billing at $175, your margin is 43%. That’s thin. And if you’ve been discounting to close deals or you’re writing off hours, your effective rate might be $150. Now your margin is 33%, and you’re wondering why profitability is slipping.
Calculating Your True Burden Rate and Cost-to-Bill Ratio
Your burden rate is the multiplier you apply to base salary to get fully-loaded cost. For most agencies, it’s 1.3x to 1.6x. Here’s how to calculate it:
- Take base salary.
- Add employer payroll taxes (FICA, unemployment, workers’ comp).
- Add benefits (health insurance, 401k match, PTO cost).
- Add overhead allocation (rent, software, admin, leadership time, non-billable staff).
Example:
- Base salary: $100,000
- Payroll taxes (7.65% FICA + state): $8,000
- Benefits (health, 401k, PTO): $15,000
- Overhead allocation (rent, software, admin): $27,000
- Fully-loaded cost: $150,000
- Burden rate: 1.5x
Now calculate your cost-to-bill ratio. Divide your blended billable rate by your fully-loaded cost per hour. The rule of thumb: you need at least 3x to 4x to hit healthy margins after accounting for realization, non-billable time, and overhead.
If your ratio is 2x or lower, you’re underpriced. If it’s 2.5x, you’re marginal. If it’s 3.5x or higher, you have pricing power and room to absorb inefficiency.
Warning: Common Burden Rate Underestimation Pitfalls
- Forgetting PTO cost. Employees take 10–15 days off per year (you’re paying salary but getting zero billable hours).
- Underestimating overhead. Rent, software, insurance, admin staff, and leadership time add up fast.
- Ignoring turnover and training costs. These are real expenses that don’t show up in base salary calculations.
- Using salary instead of total compensation. Benefits and payroll taxes can add 25–35% to base salary.
Repricing Without Losing Clients: Timing and Communication
Repricing is scary. You worry clients will walk. But here’s the truth: if your pricing doesn’t cover your costs, you can’t afford to keep those clients anyway. Better to lose a low-margin client than to subsidize their work with your cash flow.
The key is timing and segmentation. Don’t raise prices across the board overnight. Instead:
- Segment your client base by margin. Identify which clients are profitable and which aren’t.
- Reprice at renewal. When contracts come up, present new pricing. Frame it around value, not cost.
- Adjust scope to justify increases. Add deliverables or improve service levels to soften the rate hike.
- Grandfather existing work temporarily. Give clients 60–90 days’ notice of new rates for future projects.
- Let low-margin clients churn. If they leave over a 15% rate increase, they were never going to be profitable anyway.
Some clients will push back. A few will leave. That’s fine. The revenue you lose will be replaced by higher-margin work if you’re disciplined about saying no to underpriced projects. If you’re concerned about losing a client who truly values your work, consider offering a tailored solution or a retainer model to preserve the relationship while protecting your margins.
Mistake #5: Over-Staffing Senior Roles and Bench Time
Senior people are expensive. Directors, senior strategists, and account leads often command salaries of $120,000–$180,000. Fully loaded, they cost $180,000–$270,000 per year. That’s fine if they’re billable 70–80% of the time. But if they’re spending half their week in internal meetings, managing people, or doing business development, you’re carrying a massive fixed cost with limited revenue upside.
This is one of the most common structural margin problems in agencies. Leadership roles are necessary. But if you staff them as if they’re billable, your cost structure doesn’t match your revenue model.
The Billable vs. Non-Billable Role Misalignment
Most senior roles in agencies are hybrid. They’re part billable, part strategic, part operational. The problem is that agencies often hire for full-time billable capacity, then pile on non-billable responsibilities. The result? A $200,000 role generating $120,000 in billable revenue.
Here’s where it shows up:
- Account directors who spend 50% of their time on relationship management and internal coordination, not client deliverables.
- Creative directors who are in approvals, reviews, and client pitches instead of execution.
- Senior strategists who do business development, mentor junior staff, and write internal decks.
All of that is valuable work. But it’s not billable. If you’re not accounting for it in your pricing or staffing model, it’s eroding margin.
The fix? Separate billable capacity from leadership capacity. Either:
- Price leadership time into retainers. Build oversight, strategy, and relationship management into your monthly fees.
- Staff senior roles part-time or fractionally. Use project-based senior talent instead of full-time employees when utilization doesn’t justify the cost.
- Hire dedicated non-billable roles (operations, admin, BD) so senior staff can stay focused on billable work.
Restructuring Your Team Model to Improve Margin Without Cutting Headcount
You don’t have to fire people to fix this. You can restructure. Here are three approaches:
- Move senior staff to fractional or advisor roles. Pay them for 20–30 hours per week instead of 40. Free up capital to hire mid-level producers who deliver more billable hours at lower cost.
- Introduce tiered delivery models. Let junior and mid-level staff do execution. Reserve senior time for strategy, QA, and client presentations. Bill senior hours at a premium rate.
- Outsource non-billable functions. Use part-time or outsourced support for admin, HR, bookkeeping, and operations. Keep your core team focused on revenue-generating work.
The goal isn’t to minimize headcount. It’s to align cost structure with revenue model. If a role isn’t billable 60–70% of the time, it shouldn’t be priced as a full-time billable role.
Mistake #6: Not Managing Work-in-Progress (WIP) Aging and Days Sales Outstanding (DSO)
Utilization and margin are intimately tied to cash flow. You can have 80% utilization and strong gross margin, but if your WIP is sitting unbilled for 45 days and your invoices aren’t collected for another 60 days, you’re financing your client’s operations with your cash.
WIP aging is the time between when work is done and when it’s invoiced. DSO is the time between when you invoice and when you get paid. Both of these drain working capital and distort your P&L. Worse, old WIP often becomes write-offs. Work that sits unbilled for more than 30 days has a much higher chance of never being invoiced at all.
WIP Aging as a Margin Proxy: Unbilled Hours and Hidden Losses
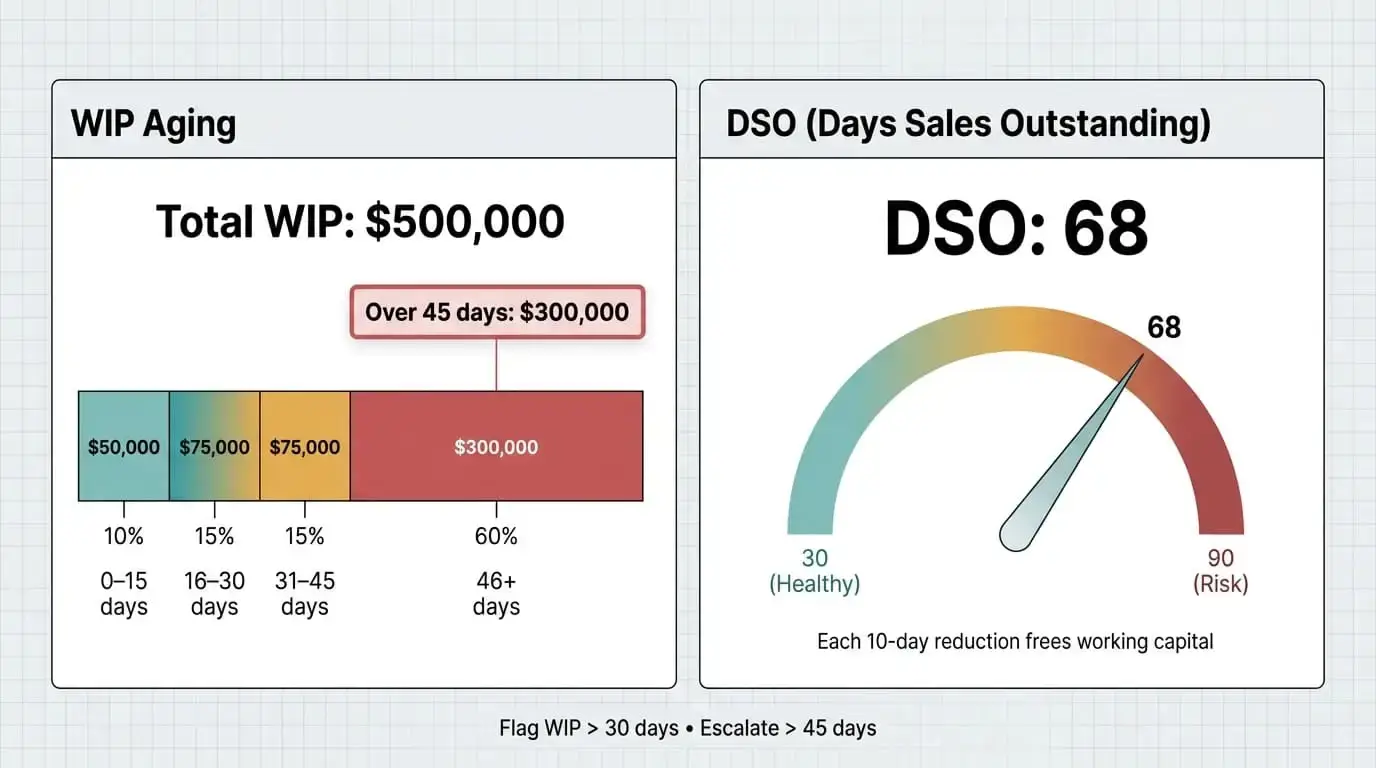
Let’s say you have $500,000 in WIP. That’s work your team has done, but you haven’t invoiced yet. If 60% of that WIP is older than 45 days, you have $300,000 of aging work. Statistically, 10–20% of that will get written off due to scope disputes, client budget issues, or internal delays.
That’s $30,000–$60,000 in margin erosion that won’t show up until you close the books. By then, it’s too late to fix. Your utilization still looked fine. Your team was busy. But the revenue never materialized.
Managing WIP aging requires discipline:
- Weekly WIP review meetings. Go through every open project. Ask: Why hasn’t this been billed? What’s blocking invoicing?
- Set billing thresholds. Invoice at least monthly. For time-and-materials work, invoice every two weeks.
- Track WIP aging in your dashboard. Flag anything over 30 days. Escalate anything over 45 days.
- Tie realization to WIP. If a project’s WIP is ballooning, it’s a signal of scope creep or underpricing.
A fractional CFO will build this into your financial rhythm. They’ll make WIP aging a standing agenda item. They’ll quantify the cost of delays. And they’ll push you to invoice faster, even if it feels uncomfortable.
DSO Management and Invoicing Discipline
DSO is the flip side of WIP. Once you invoice, how long does it take to collect? The industry benchmark for agencies is 30–45 days. If yours is 60–90 days, you’re carrying significant working capital drag.
High DSO means you’re extending credit to your clients. You’re paying your team’s salaries today and waiting months to get paid. If you’re growing, that gap widens. You need a line of credit or cash reserves to bridge it. Both cost money, which reduces net margin.
Improving DSO requires operational changes:
- Invoice immediately. The longer you wait to send an invoice, the longer you wait to get paid.
- Set payment terms and enforce them. Net 30 is standard. Net 15 is better if your clients will accept it.
- Follow up on overdue invoices weekly. Automate reminders. Escalate to leadership at 45 days.
- Require deposits or milestone billing. Don’t float large projects on your cash.
- Prune clients with chronic payment issues. A client who pays in 90 days is destroying your cash flow and margin.
Cash flow is a margin issue. Every day you wait to collect is a day you’re financing operations out of your pocket. A fractional CFO will model the impact of reducing DSO by 10–15 days. For a $5M agency, that can free up $150,000–$200,000 in working capital, reducing the need for debt and improving effective profitability.
Mistake #7: Benchmarking Utilization Without Adjusting for Service Delivery Model
Not all service models are created equal. A retainer-based agency with predictable, recurring work can sustain utilization of 85–90% without burnout. A project-based shop with lumpy demand and heavy onboarding will struggle to hit 75%. An advisory firm with high-touch, strategic work might thrive at 60% because the billable rate is high and the client relationship is sticky.
The mistake is copying a competitor’s utilization target without understanding whether your business model matches theirs. You end up chasing a number that doesn’t fit your economics.
Service Model Variance: Why Your Utilization Target Isn’t Your Peer’s
Here’s a breakdown of utilization benchmarks by service type:
| Service Model | Healthy Utilization Range | Why It Varies |
|---|---|---|
| Retainer / recurring services | 85–95% | Predictable scope, recurring work, low onboarding overhead. |
| Project-based services | 70–80% | Variable demand, project onboarding, scope changes, and between-project downtime. |
| Time-and-materials work | 75–85% | Billing as you go reduces write-off risk, but client demand can be variable. |
| Advisory / strategic services | 60–75% | High bill rates and deep expertise justify lower utilization (value over volume). |
| Hybrid models | 70–80% | Mix of retainer and project work (utilization depends on revenue composition). |
If you’re running a project-based creative agency and benchmarking against a retainer-focused marketing ops shop, you’ll always feel like you’re underperforming. The models are different. The economics are different. The targets should be different.
The Diagnostic Framework: From Utilization to Margin Health
If you’ve recognized your agency in any of these mistakes, here’s a simple diagnostic framework to assess where your margin is leaking:
Checklist:
- Calculate realization rate by project and client. Is it above 85%? If not, where are write-offs happening?
- Review utilization by role and seniority. Are senior staff billable 60–70%? Are producers at 75–85%?
- Audit project-level profitability. Which 20% of projects drive 80% of margin? Which are losing money?
- Calculate fully-loaded labor costs and cost-to-bill ratios. Are you billing at 3x–4x fully-loaded cost?
- Check WIP aging and DSO. Is unbilled work sitting for more than 30 days? Are invoices being collected within 45 days?
- Assess staffing model. Are senior roles burdened with non-billable work? Can you restructure to improve margin?
- Benchmark utilization against your service model. Are you targeting the right range for retainer vs. project vs. advisory work?
Quick Wins: 3 Immediate Actions to Diagnose Your Margin Gap
- Run a realization report for the last quarter. Identify which clients or projects have the widest gap between logged hours and billed revenue. Start there.
- Calculate your true burden rate for top three roles. Compare it to your bill rates. If the multiplier is under 3x, you’re underpriced.
- Review WIP aging this week. Invoice everything over 30 days immediately. Escalate anything over 45 days to leadership for resolution.
These three actions won’t fix everything overnight. But they’ll give you clarity on where the margin is leaking and whether you need outside help to plug the gaps.
When to Bring in a Fractional CFO to Fix the Utilization-Margin Gap
Not every agency needs a fractional CFO. If you’re under $2M in revenue and your financials are simple, a good bookkeeper and some disciplined spreadsheets can get you by. But once you hit $4M–$6M in revenue, 15–20 employees, and multiple service lines, the complexity outpaces what founders can manage on nights and weekends.
Here are the indicators that it’s time to bring in a fractional CFO:
- You can’t answer basic margin questions. Which clients are profitable? Which services? Which projects?
- Your utilization looks strong, but cash flow is tight. You’re busy, but you can’t explain where the money is going.
- You’re making pricing and hiring decisions without modeling the impact. You’re guessing instead of calculating.
- You have a full-time bookkeeper but no one who can translate the numbers into strategy. Bookkeepers record history (CFOs plan the future).
- You’re preparing for growth, a sale, or outside investment. Investors and buyers want clean financials, margin transparency, and forward-looking projections. A fractional CFO builds that.
Fractional CFO services typically cost $3,000–$15,000 per month depending on complexity, engagement hours, and scope. For an agency doing $5M in revenue, improving gross margin from 45% to 55% adds $500,000 in gross profit annually. Even a $10,000/month CFO retainer pays for itself many times over if they can close realization gaps, reprice underperforming work, and tighten WIP and DSO cycles.
If you’re wrestling with the utilization-margin paradox, you need someone who can connect the dots between time tracking, project accounting, pricing strategy, and cash flow. That’s not a bookkeeper’s job. It’s a CFO’s job. And for most agencies, fractional is the right model until you’re big enough to justify a full-time hire. Many agencies find that as they scale beyond $10M–$15M in revenue, the ROI of retaining expert financial leadership on a fractional basis continues to outweigh the cost of a full-time CFO, particularly if growth or exit planning remains a priority.
Conclusion: Utilization Is a Trap Without Margin Discipline
High utilization feels like success. Your team is busy. The calendars are full. The work is getting done. But if margin isn’t following, you’re not building a sustainable business. You’re building a treadmill.
The agencies that scale profitably understand that utilization is a means, not an end. It’s a tool for planning capacity and managing workflows. But it’s not a profit metric. Profit comes from realization, pricing discipline, cost structure alignment, and ruthless focus on high-margin work.
If your utilization looks healthy but your P&L doesn’t, you’re not alone. This is one of the most common problems agencies face. The good news? It’s fixable. You need visibility into project-level margins. You need realization tracking. You need pricing discipline. And you need someone who can tie those numbers together into a financial operating model that actually works.
That’s where a fractional CFO earns their keep. They’ll diagnose where margin is leaking. They’ll model the cost of fixing it. And they’ll help you build the financial discipline to turn busyness into profitability. Because at the end of the day, utilization without margin isn’t health. It’s just noise.
Frequently Asked Questions
Why can my agency have high utilization but still struggle with profitability?
High utilization measures how busy your team is, not whether that busyness is profitable. If you’re writing off hours, underpricing projects, or absorbing scope creep, you can be fully booked and still lose money. Profitability depends on realization rate, pricing discipline, and managing project-level margins, not just keeping calendars full.
What is realization rate, and why does it matter more than utilization?
Realization rate is the percentage of logged hours that actually get billed and collected. If your team logs 1,000 hours but you only invoice 700 due to write-offs and discounts, your realization is 70%. Even if utilization is 85%, poor realization means you’re paying for work you never capture as revenue. Realization above 85% is healthy. Below that signals pricing or scoping problems.
How much should I be billing relative to my fully-loaded labor costs?
You should bill at least 3x to 4x your fully-loaded labor cost (salary plus benefits, taxes, and overhead) to maintain healthy margins. If your fully-loaded cost per hour is $100, your bill rate should be $300–$400. Anything less leaves you vulnerable to margin erosion from non-billable time, write-offs, and overhead.
At what revenue or headcount should I consider hiring a fractional CFO?
Most agencies benefit from a fractional CFO once they reach $4M–$6M in revenue and 15–20 employees. At that scale, complexity increases (multiple service lines, client mix, staffing decisions) and the financial modeling required outpaces what founders can manage part-time. Fractional CFO retainers typically cost $3,000–$15,000 per month, but the margin improvements often pay for themselves many times over.
What is the ideal utilization range for agency producers and senior staff?
For producers (mid-level and senior delivery roles), healthy utilization is 75–85%. For senior leadership and account directors who split time between billable and strategic work, 65–80% is realistic. Agency-wide utilization (including non-billable roles and time off) typically lands around 50–60%. Pushing utilization above 85% consistently increases burnout and attrition risk without improving margins.
How do I fix projects that have strong utilization but weak margins?
First, calculate project-level profitability: revenue minus direct labor, overhead allocation, and realization adjustments. Identify which clients or projects fall below 10–15% margin. Then decide: Can you reprice or tighten scope to make the work profitable? If not, plan an exit. Better to operate at 70% utilization on high-margin work than 85% on break-even projects.
What are WIP aging and DSO, and why do they matter for profitability?
WIP (work in progress) aging measures how long completed work sits unbilled. DSO (days sales outstanding) measures how long it takes to collect payment after invoicing. High WIP aging often leads to write-offs, and high DSO drains working capital. Together, they create a cash-and-profit disconnect: your team is busy, but cash flow is tight and margins erode due to delayed or lost revenue.
How can I tell if my agency is underpriced?
Calculate your cost-to-bill ratio: divide your blended billable rate by your fully-loaded cost per hour. If the ratio is under 3x, you’re likely underpriced. Also review realization rate by client. If it’s consistently below 85%, you’re either underpricing or absorbing too much scope creep. Both will show up as weak gross margin (below 45–50%) and thin net margin (under 15%).