
Most agency leaders operate with a dangerous blind spot. You know your monthly revenue, you track your active client count, and you monitor overall agency margin. But here’s the question that should keep you awake: which clients are actually making you money?
An agency with $50,000 in monthly client fees might assume profitability. Yet when you allocate 400 billable hours, factor in revision cycles, account the leadership time spent in endless approval loops, and assign actual overhead, that same client can flip to margin-negative. This happens constantly, and most agency owners won’t discover it until cash flow problems force a hard look at the books.
The difference between profitable growth and revenue-fueled burnout comes down to measurement. Rigorous client-level profitability analysis that shows you exactly where your margin lives and where it dies. Let’s fix that blind spot.

Why Marketing Agencies Can’t Ignore Client Profitability
You’re chasing new business while bleeding margin on half your existing book. That’s the harsh reality for agencies that measure success purely by top-line growth.
Consider the mechanics. A retainer client pays $8,000 monthly. Sounds solid until you track the hours. Your account team logs 60 hours. Creative burns another 45. Strategy adds 20. Leadership reviews consume 15 more. Suddenly you’re at 140 hours against an $8,000 fee, and your blended internal cost per hour sits around $75 when you factor in salaries, benefits, software, and space. That client just cost you $10,500 to service. You lost $2,500 this month, and you’ll lose it again next month unless something changes.
Agencies that don’t track client-level economics make three predictable mistakes. They renew unprofitable clients because the revenue number looks good. They under-price new work because they lack cost visibility. They allocate their best talent to demanding, low-margin accounts while profitable clients get junior resources. Each decision erodes the foundation.
The fix starts with knowing your numbers at the client level. Not quarterly, not annually, but as part of your monthly operating rhythm. When you can see contribution margin by account, you make different choices about pricing, staffing, scope, and renewals. You stop subsidizing bad business with the profits from good clients.
The Three Frameworks for Measuring Client Profitability
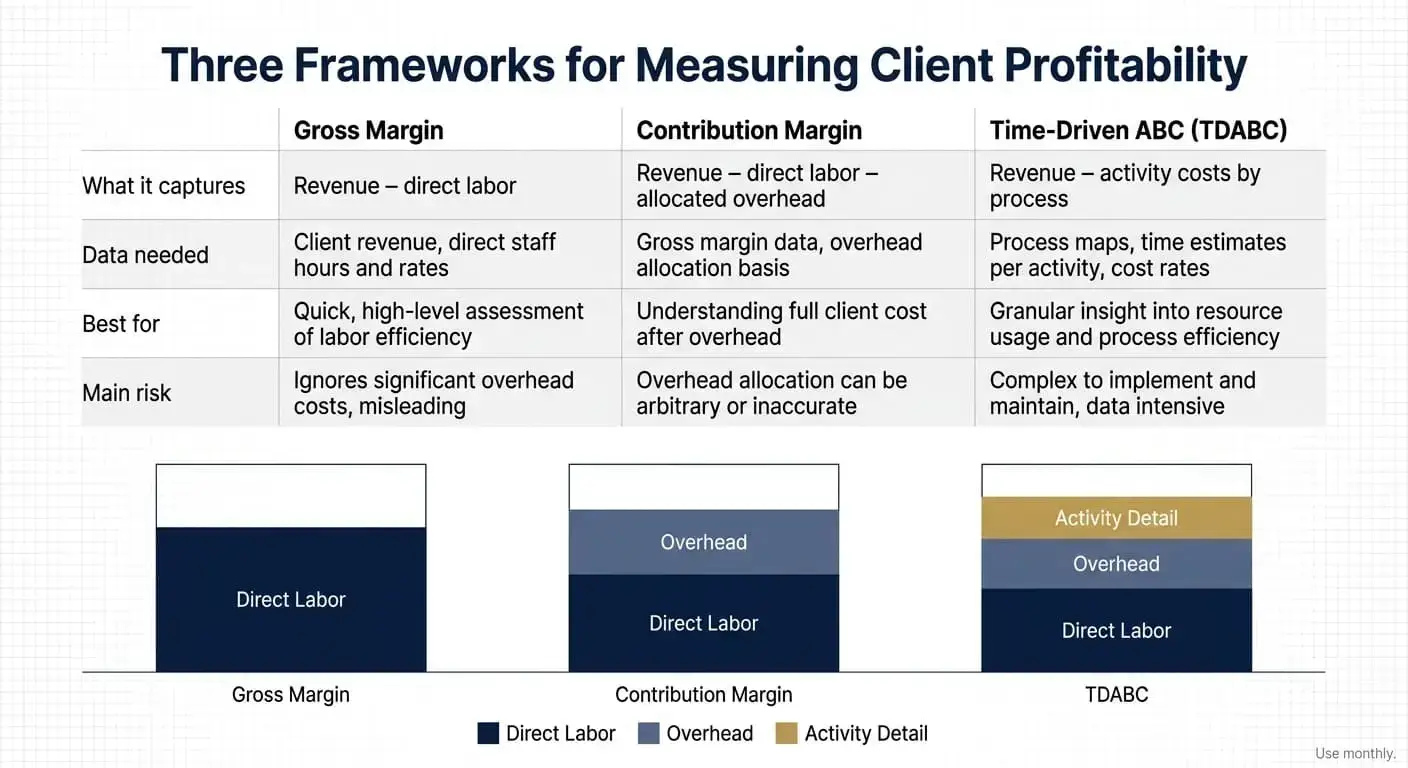
Agencies have three paths to measuring client profitability, each trading precision for complexity. The right choice depends on your data maturity and how much operational detail you’re prepared to manage.
Here’s how they compare:
| Framework | What It Measures | Best For | Limitation |
|---|---|---|---|
| Gross Margin | Revenue minus direct labor costs | Quick baseline assessment, early-stage agencies | Ignores overhead and indirect costs entirely |
| Contribution Margin | Revenue minus direct costs minus allocated overhead | Mid-size agencies with stable cost structures | Requires overhead allocation assumptions |
| Time-Driven ABC (TDABC) | Revenue minus all activity costs at granular level | Complex service mixes, resource-constrained teams | High data collection and maintenance burden |
Each framework answers a different business question. Gross margin tells you if a client covers their direct costs. Contribution margin reveals whether they’re funding their share of rent, software, and back-office support. TDABC exposes hidden inefficiencies like excessive revision cycles or scope creep that traditional accounting never catches.
Gross Margin: The Quick-and-Dirty Approach
Gross margin strips profitability down to its simplest form. Take client revenue, subtract the direct labor cost of the team serving that client, and you’ve got your answer.
This works when you’re already tracking billable hours and know your team’s loaded cost (base salary plus benefits and taxes). A designer earning $70,000 annually might carry a loaded cost of $95,000 when you add health insurance, payroll taxes, and 401(k) match. Divide that by 2,080 working hours and you’ve got an hourly cost rate. Multiply hours logged to the client by that rate, subtract from revenue, and there’s your gross margin.
The limitation is obvious. You’re ignoring everything that isn’t directly billable. Your project management platform, the creative director’s time reviewing decks, office space, accounting services, and every other fixed cost that keeps the doors open. Gross margin can show a client at 40% profitability while your agency operates at 10% net margin because overhead consumes the difference.
Still, it’s fast. If you need a baseline view of which clients are covering their direct costs and which aren’t, gross margin gives you that answer this afternoon. Use it as a starting point, not the finish line.
Contribution Margin: The Overhead-Aware Middle Ground
Contribution margin fixes the gross margin blind spot by assigning each client a fair share of your indirect costs.
Start with gross margin, then allocate overhead proportionally. If your agency spends $30,000 monthly on software, office rent, HR, finance, and administrative salaries, and Client A represents 15% of your total revenue, assign them $4,500 of that overhead. Subtract it from their gross margin and you’ve calculated contribution margin.
This approach reveals which clients are genuinely profitable after covering not just their direct service costs but also their burden of keeping the agency operational. A client with strong gross margin can flip to breakeven or negative once you layer in overhead, especially if they’re high-touch or consume disproportionate leadership time.
The sweet spot for most mid-size agencies sits here. You’re not drowning in data collection, but you’re seeing a clearer picture of economic reality. Contribution margin works well when your cost structure is relatively stable and clients consume resources in rough proportion to their revenue. When that assumption breaks, you need the precision of time-driven costing.
Time-Driven Activity-Based Costing: The Precision Method
Time-Driven Activity-Based Costing treats profitability as the sum of every activity performed for a client, priced at the true cost of the capacity consumed.
You start by mapping activities: client onboarding, creative concepting, revision rounds, status meetings, reporting, invoicing. For each activity, calculate a capacity cost rate. If your creative team costs $200,000 annually and has 8,000 available hours, that’s $25 per hour of creative capacity. Then measure how much time each activity consumes per client. Onboarding takes 12 hours, concepting averages 18, revisions run 6 hours per cycle.
Multiply activity time by capacity cost rate, sum across all activities, and subtract from revenue. What emerges is a profitability view that captures operational reality in a way traditional accounting cannot. You’ll see that Client B’s three revision cycles per campaign are costing you $450 in capacity each month. Client C’s preference for live meetings over async updates burns another $300 in otherwise-billable hours.
The ROI justifies the lift when you’re managing complex service mixes or operating near capacity. TDABC exposes where margin leaks, which clients consume scarce senior talent, and which operational changes yield the highest return. For agencies serious about optimization, it’s the gold standard. For those just starting to measure profitability, it can wait until simpler frameworks are running smoothly. If you’re struggling to get clarity on your cost structure and client economics, working with a financial expert who understands agency operations can accelerate your path to better margins (morganfractionalcfo.com).
Step 1: Audit Your Current Cost Structure
You can’t allocate costs you haven’t inventoried. Start with a complete list of everything your agency spends money on, organized by category.
Personnel costs:
- Base salaries for all staff
- Payroll taxes and benefits (health insurance, retirement, PTO accrual)
- Contractor and freelance fees
- Recruiting and onboarding expenses
Technology and tools:
- Project management platforms
- Creative software subscriptions
- CRM and client communication tools
- Hosting, domains, and technical infrastructure
- Analytics and reporting software
Occupancy and operations:
- Office rent or coworking memberships
- Utilities and internet
- Office supplies and equipment
- Insurance (general liability, E&O, workers’ comp)
Client delivery:
- Media spend managed on behalf of clients
- Stock photography and licensed assets
- Third-party production vendors
- Printing and shipping
Administrative and finance:
- Accounting and bookkeeping services
- Legal fees
- Bank fees and credit card processing
- Professional development and training
This audit produces the denominator for your overhead allocation and the foundation for contribution margin calculations. Until you know what you’re actually spending and where those dollars go, any profitability metric remains a guess.
Separating Direct vs. Indirect Costs
Not all costs tie to specific client work. The distinction between direct and indirect determines how you allocate expenses in your profitability model.
Direct costs attach to a specific client or project. These include the salary and benefits of team members working billable hours for that client, subcontractor fees for work done exclusively for that engagement, and any media spend or production costs charged through to the client. If you wouldn’t incur the cost without that client relationship, it’s direct.
Indirect costs support the overall operation but don’t map cleanly to individual clients. Your project management software serves all clients. Your office rent doesn’t change whether you have five clients or fifteen. Leadership time spent in strategic planning, financial reviews, and business development benefits the agency broadly, not just one account.
Agencies often miscategorize account management and creative leadership. If your account director splits time across three clients, their salary is a direct cost allocated proportionally based on time logged. If your creative director reviews all projects but doesn’t bill hours, their comp becomes overhead distributed across the client base. The line isn’t always clean, but precision beats guesswork every time.
Step 2: Implement Time Tracking and Resource Allocation
Profitability measurement without granular time data is fiction. You’re building a model on assumptions, and those assumptions will mislead you every single time.
Accurate client economics require every team member to log hours at the project and task level. Not rounded estimates submitted at month-end. Daily time entries that capture actual hours worked, the client served, and the type of work performed. This is the only way to know what a client actually costs to service.
Agencies resist time tracking because it feels bureaucratic and because teams push back. The transition requires discipline. Set the expectation that time entries happen daily, not weekly. Make the tool easy to use. Tie compliance to performance reviews if necessary. The data you gain outweighs the friction.
Pro-Tip: Start time tracking with just billable client work for the first 30 days. Once the habit forms, expand to include internal projects and non-billable activities. Gradual adoption beats trying to track everything perfectly from day one and watching the system collapse under its own weight.
Choosing the Right Time-Tracking Tool
The best time-tracking tool is the one your team will actually use. That means simple, fast, and integrated with the rest of your stack.
Harvest offers clean time entry, expense tracking, and invoicing in one platform. It integrates with Asana, Trello, and other project tools, allowing one-click time starts from tasks. It’s ideal for smaller agencies that need quick setup and minimal learning curve.
Toggl focuses purely on time tracking with robust reporting and team dashboards. The interface is dead simple, entry takes seconds, and the reporting reveals utilization and client allocation trends. Best for teams that need time data but handle invoicing and project management elsewhere.
Kimble gets built for professional services firms with complex resource planning needs. It combines time tracking, resource forecasting, and financial management in one system. It’s overkill for a 10-person shop, but if you’re managing 30+ people across multiple service lines, the investment pays off in planning precision.
Your decision criteria should be ease of adoption and data export capability. If the tool requires five clicks to log an hour, adoption will fail. If you can’t export time data into your contribution margin model or dashboard, you’re building a silo.
Assigning Costs to Clients and Projects
Once time data flows in, you need allocation rules that convert hours into dollar costs tied to clients.
Start with loaded cost per employee. Take annual salary, add benefits and payroll taxes (typically 25 to 35% of salary), and divide by billable capacity. If you expect 1,500 billable hours annually from a strategist earning $80,000, their loaded cost is roughly $106,000, or about $71 per billable hour.
Multiply logged hours by loaded cost rate for each team member, sum across all people working on the client, and you’ve got direct labor cost. Add any third-party spend, and you have total direct costs.
For split roles, allocate proportionally. An account manager working 60 hours for Client A and 40 hours for Client B in a given month gets 60% of their cost assigned to A, 40% to B. Simple, defensible, and accurate enough.
Overhead allocation comes next. Calculate your total monthly overhead (everything that isn’t direct labor or pass-through costs), then assign each client a percentage based on their share of revenue or billable hours. Both methods work, but revenue-based allocation is simpler if your clients have similar service intensity. If one client consumes disproportionate leadership time or requires more complex tooling, consider activity-based allocation rules for better precision.

Step 3: Build Your Profitability Dashboard
Data collection only matters if it informs decisions. A profitability dashboard turns raw time and cost inputs into visual clarity on which clients fund your growth and which drain resources.
Your dashboard should refresh monthly or quarterly, synced to your accounting close cycle. It needs to answer four questions at a glance: Which clients are most profitable in absolute dollars? Which deliver the highest margin percentages? Where is utilization strong or weak? Where are you writing down hours or discounting rates?
Start with a single view showing all active clients, revenue, direct costs, allocated overhead, contribution margin in dollars, and contribution margin as a percentage. Sort by margin percentage to spot outliers immediately. Add a column for billable hours consumed so you can compare high-revenue, low-margin clients against low-revenue, high-margin accounts and understand the trade-offs.
Layer in KPIs that reveal operational health beyond just profit: utilization rate tells you what percentage of available capacity you’re monetizing, realization rate shows how much of your standard rate structure you’re actually collecting, and project-level margin exposes whether specific campaigns or retainers are subsidizing others within the same client relationship.
Essential KPIs for Agency Profitability
Track these five metrics to keep your finger on the economic pulse of your client book.
Gross margin percentage measures revenue minus direct labor costs, divided by revenue. It tells you how much is left after paying the people who did the work. Target 50 to 60% for healthy agencies. Below 40% signals underpricing or overstaffing.
Net margin percentage takes total revenue, subtracts all costs including overhead, and divides by revenue. This is your true bottom line. Agencies should target 15 to 25% net margin. Anything below 10% leaves no room for investment or error.
Realization rate compares billed revenue to the value of hours logged at standard rates. If your team worked 100 hours at a $150 standard rate but you only billed $12,000 instead of $15,000, your realization rate is 80%. Low realization means you’re discounting too much or writing off hours. Healthy agencies run at 85 to 95%.
Utilization rate divides billable hours by total available hours. If an employee works 160 hours in a month and logs 120 as billable, utilization is 75%. Target 70 to 80% for client-facing roles. Below 60% indicates underutilized capacity or too much non-billable work. Above 85% risks burnout and quality issues.
Project-level margin isolates profitability for individual campaigns or deliverables within a client relationship. A client might look profitable overall while their monthly retainer funds losses on project work. Breaking this out prevents cross-subsidization and informs scope and pricing decisions at the engagement level.
Each metric drives a different decision. Gross margin tells you if you’re pricing work correctly. Net margin tells you if the business model works. Realization tells you if you’re capturing the value you create. Utilization tells you if you’re deploying talent efficiently. Project margin tells you which types of work to grow and which to phase out.
Tool Integration: Connecting Time Data to Your P&L
The simplest profitability dashboard lives in a Google Sheet fed by time-tracking exports and accounting data. You don’t need enterprise BI to start.
Export monthly time logs from your tracking tool as a CSV. Pull revenue and expense totals from your accounting system. Create formulas that allocate overhead, calculate loaded costs, and compute contribution margin by client. Add conditional formatting to highlight red (negative margin), yellow (low margin), and green (target margin or better) accounts.
This manual process works for agencies under 25 people or those just starting to measure profitability. You’ll spend a few hours each month updating the model, but that’s a small price for economic clarity.
As you scale, consider lightweight automation through Zapier or native reporting in your project management tool. Many platforms offer profitability modules that pull time, cost, and revenue data automatically and generate dashboards without manual exports. Harvest, Teamwork, and Kimble all include these features.
Custom dashboards in Tableau or Power BI become relevant when you’re managing multiple service lines, complex client portfolios, or need real-time visibility for leadership. Treat them as a future upgrade, not a day-one requirement. Get the data flowing and the discipline established first. Polish the visualization layer later. When you’re ready to move beyond spreadsheets and build a system that scales with your agency, bringing in someone who’s built these frameworks before can save months of trial and error (morganfractionalcfo.com).
Step 4: Set Your Measurement Cadence and Review Process
Profitability data only drives better decisions if you actually review it and act on what you find. That requires a rhythm, not ad-hoc analysis when something feels wrong.
Set up a monthly or quarterly cadence for reviewing client profitability results. Leadership, finance, and account managers should attend. The meeting accomplishes three things: identify trends (which clients are improving or declining in margin), flag outliers (accounts that warrant immediate repricing or scope conversations), and decide on actions (renew, reprice, optimize, or exit).
Monthly tracking works best for agencies with volatile workloads or project-based revenue. You catch margin erosion early, before it compounds across quarters. Quarterly reviews suit retainer-heavy agencies with stable client rosters and predictable monthly service delivery. You’re trading early detection for reduced meeting overhead.
Start with quarterly reviews if monthly feels burdensome. You can always tighten the cadence once the discipline is established and the value is clear. The worst outcome is launching monthly reviews, burning out your team on the administrative lift, and abandoning the process entirely.
Monthly Snapshot vs. Quarterly Deep Dive
Monthly snapshots are about early warning signals. You’re checking for clients who dipped below margin thresholds, projects that ran over budget, or utilization that fell off a cliff. The meeting is short (30 to 45 minutes), and the action items are tactical: follow up with account leads on specific clients, adjust staffing on underperforming projects, or start pricing conversations.
Quarterly deep dives are strategic. You’re analyzing trends across the entire portfolio, evaluating which service lines or client types deliver the best economics, and making decisions about where to invest capacity and where to pull back. You might decide to phase out certain project types, adjust your pricing model, or shift your new business focus based on what the data reveals.
Both serve a purpose. Monthly keeps you from drifting into trouble. Quarterly sets the strategic direction. If you can only do one, start with quarterly and add monthly once the process feels manageable.
Step 5: Define Profitability Thresholds and Action Triggers
Measurement without decision rules is just reporting. You need clear thresholds that define what margin levels demand action and what those actions should be.
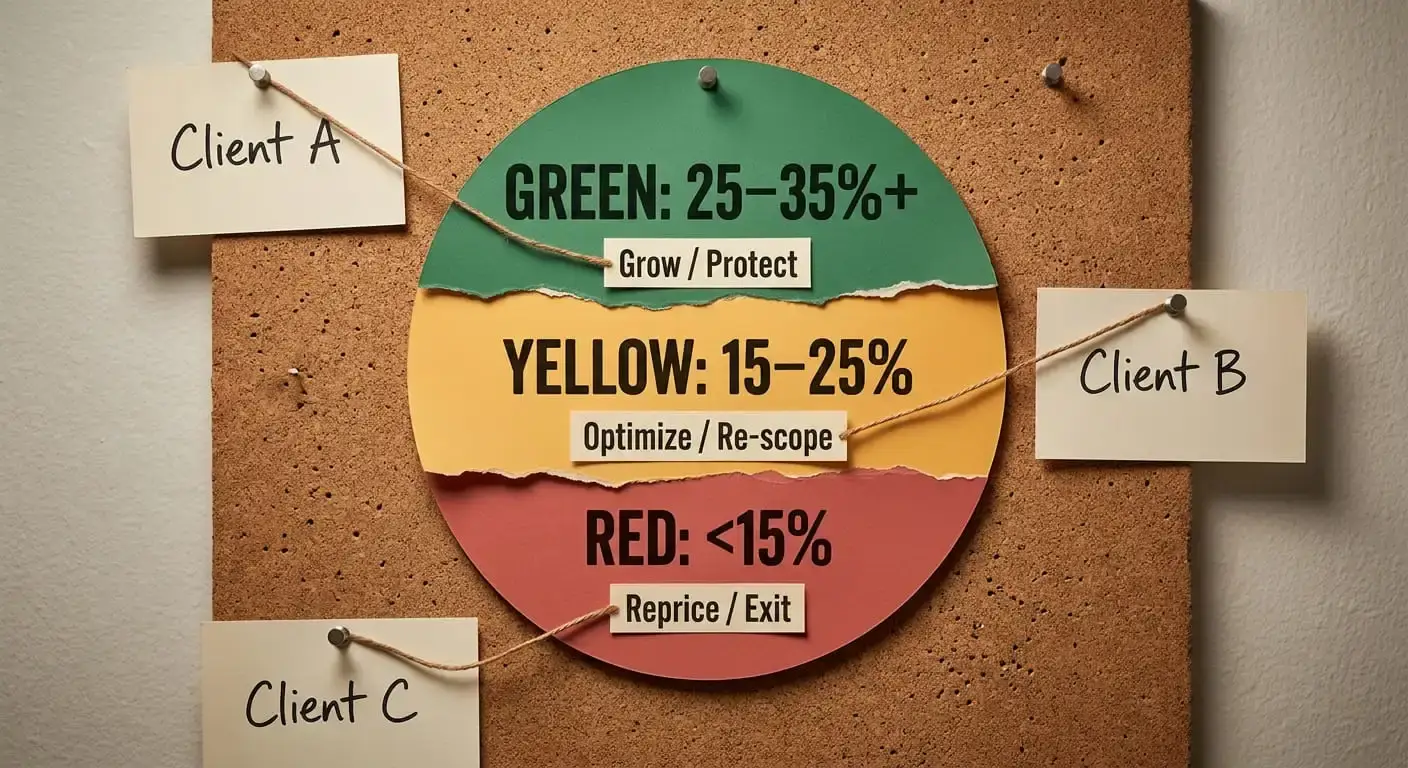
Set a three-tier system. Green zone clients exceed your target margin (typically 25 to 35% contribution margin for healthy agencies). These are the accounts you want to grow, protect, and replicate. Yellow zone clients sit between 15 and 25% margin. They’re acceptable but not ideal. Monitor them closely, look for optimization opportunities, and avoid over-servicing. Red zone clients fall below 15% margin or operate at a loss. These trigger immediate repricing conversations or exit planning.
Your thresholds should reflect your specific cost structure and business model. A lean agency with low overhead can survive on thinner margins. A full-service shop with significant fixed costs needs higher contribution margins to stay viable. Define what works for your economics, then enforce those rules consistently.
Red, Yellow, and Green Zones
Green zone clients are your profit engine. They pay fair rates, respect scope, consume resources efficiently, and renew without drama. Your strategic priority is to find more clients like them and make sure you’re staffing them with the talent they deserve.
Yellow zone clients are watchlist accounts. Maybe they’re new and ramping, or they’re transitioning service models, or they’re profitable but marginal. You’re not ready to exit, but you’re not investing heavily either. What tends to work is moving them into green through scope optimization, rate adjustments, or operational improvements. If they stay yellow for two consecutive quarters, start a formal repricing conversation.
Red zone clients are burning cash. They might be legacy accounts grandfathered into outdated pricing, high-maintenance relationships that consume disproportionate leadership time, or simply misaligned on value. If a client has been red for two quarters and shows no path to profitability, you need an exit timeline. That might mean a rate increase that brings them to breakeven, a scope reduction that makes the engagement viable, or a non-renewal at the next contract cycle.
The system only works if you follow through. Agencies often identify unprofitable clients and then do nothing because the revenue feels too risky to lose. That’s how you end up working harder while making less. Be disciplined.
Common Repricing Conversations and Exit Criteria
Repricing a client is uncomfortable but necessary. Frame the conversation around market dynamics and the value you deliver, not your internal cost pressures.
“We’re adjusting our rate structure to reflect current market conditions and the level of expertise we’re bringing to your account. Effective next quarter, our monthly retainer will increase from $8,000 to $10,500. This reflects the strategic value we’ve delivered over the past year and positions us to continue investing in your success.”
Position it as a recalibration, not a penalty. Anchor the increase to outcomes you’ve driven, capabilities you’ve added, or market benchmarks for similar work. Give adequate notice (ideally 60 to 90 days) so the client can plan and you avoid burning the relationship even if they choose to walk.
Exit readiness means the client has been red or yellow for at least two quarters, their contract renewal is within six months, and you’ve exhausted reasonable optimization efforts. You’ve had the repricing conversation and they’ve declined. At that point, non-renewal is a financial decision, not an emotional one. Give professional notice, offer a transition plan, and redirect that capacity to clients who value your work appropriately.
Pro-Tip: Quick Wins in Your First 90 Days
You don’t need a perfect profitability system to start making better decisions. Focus on quick wins that deliver immediate insight with minimal setup.
Identify your top three most-profitable clients and bottom three least-profitable. Use gross margin if that’s all you have. Once you’ve flagged the extremes, analyze what makes them different. Look at pricing, scope, team composition, revision frequency, communication patterns, and strategic alignment.
You’ll spot patterns. Maybe your most profitable clients pay premium rates and trust your expertise. Your least profitable accepted deep discounts and micromanage every decision. Or your high-margin accounts have clear points of contact and streamlined approval processes, while your low-margin clients involve multiple stakeholders and endless revision cycles.
Use those insights immediately. Adjust your new business targeting to go after clients that match your profitable profile. Modify your scoping and pricing for prospects that look like your problem accounts. Start conversations with your yellow-zone clients about how to move them toward the operational patterns of your green-zone accounts.
This exercise takes a few hours and produces clarity that most agencies never get. Do it this week.
Avoiding Common Pitfalls
Agencies stumble in predictable ways when they start measuring client profitability. Watch for these three traps.
Measuring gross margin and ignoring overhead. You’ll think you’re profitable when you’re actually underwater. Contribution margin or better is the minimum standard for making real decisions. Gross margin alone is a misleading comfort blanket.
Lumping entire clients into one profitability number. A client might be profitable on their retainer and deeply unprofitable on project work. If you only see the blended number, you won’t know which services to grow and which to phase out. Break profitability down to the engagement level, not just the client level.
Collecting data but not acting on insights. The most common failure mode is putting together dashboards, running reports, and then doing absolutely nothing with the information. Profitability measurement is a waste of time unless it changes your pricing, staffing, scoping, or client mix. Data without action is just expensive decoration.
Measurement as Competitive Advantage
Most agencies don’t measure client profitability rigorously, which means the ones that do gain a compounding edge.
You grow faster because you’re not subsidizing unprofitable work. Every dollar of capacity flows to clients who value and compensate it fairly. You price smarter because you know exactly what it costs to deliver each type of service and can structure engagements that protect margin. You make better hiring and investment decisions because you know which service lines and client types drive true economic value.
Profitability measurement stops being a cost-cutting exercise and starts being a strategic asset. You can scale confidently because your unit economics are sound. You can weather downturns because you’ve pruned the clients who would have dragged you under. You can invest in your team because you’ve freed up margin that was previously leaking into uncompensated scope creep and inefficiency.
The agencies that survive and thrive over the next decade won’t be the ones with the flashiest creative or the biggest client lists. They’ll be the ones that know their numbers, protect their margins, and deploy resources with precision. Build that capability now, and you’ll outpace competitors who are still guessing.