
Revenue is climbing, shipments are up, the sales team is celebrating another record quarter, and yet your bank balance is shrinking. If you’re a distribution business owner staring at this contradiction, you aren’t imagining things. Growth (especially fast growth) can bleed cash faster than you can invoice for it. This isn’t a sales strategy problem. It’s a working capital blind spot that sneaks up on distributors who focus on top-line wins while inventory, receivables, and supplier terms silently suffocate liquidity.
The mechanics are simple but brutal. Every dollar of growth demands immediate cash to buy more stock and extend more credit, while payment from customers drifts weeks or months into the future. Without active management of your cash conversion cycle, you’ll fund expansion out of operating cash instead of profit. You’ll hit a wall long before you realize you’ve been building one.

The Growth Paradox: Why Your Revenue Is Up but Your Bank Account Is Down
Here’s an example. A mid-market distributor hits 20% year-over-year revenue growth. The board is pleased. Customers are happy. Inside the finance team, though, alarm bells are ringing. Cash is down 15% from the same quarter last year. The business isn’t losing money on paper. EBITDA looks fine. So where did the cash go?
It went into the guts of the business. Inventory ballooned to support more SKUs and higher order volumes. Customers negotiated longer payment windows to secure bigger contracts. Suppliers didn’t reciprocate with matching terms. And nobody modeled what all of this would do to liquidity before it happened.
This paradox plays out over and over in distribution. More sales require more stuff on shelves and more accounts receivable in flight. Cash doesn’t arrive until customers pay. Suppliers want payment now. The gap between buying inventory and collecting from customers is your cash conversion cycle. When that gap widens, cash bleeds out. Growth becomes a liability instead of an asset.
Mistake #1: Ignoring Days Inventory Outstanding (DIO) as You Expand SKUs
Distributors chasing revenue often add new product lines without stopping to ask whether those products will actually turn. More SKUs feel like diversification and competitive strength. In reality, they often become dead weight that ties up cash and warehouse space without producing velocity.
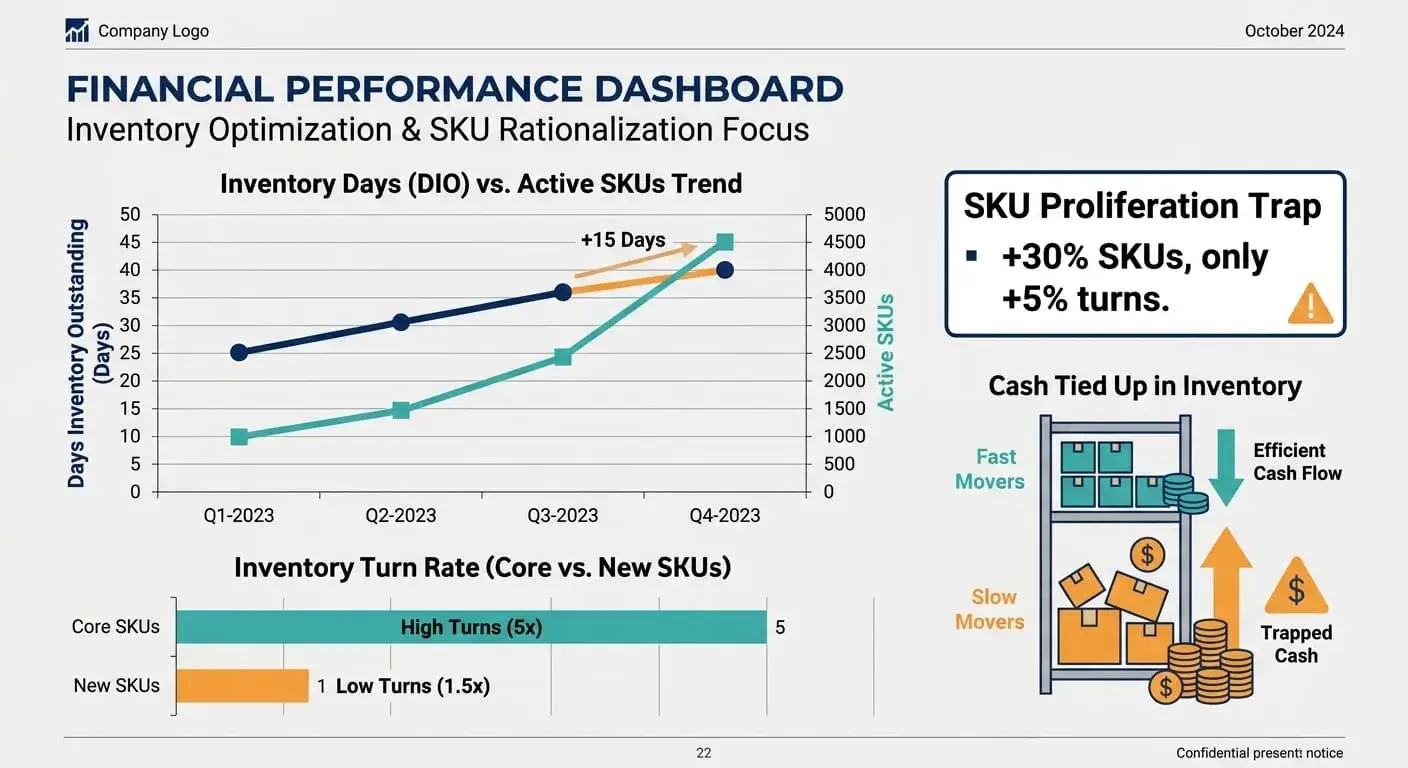
The classic mistake is celebrating the sale of a new line without tracking how long it sits in stock or how often it turns. If you’re adding 30% more SKUs but only capturing 5% more turns, you’ve just locked cash into slow-moving or non-moving inventory. That cash would’ve been better deployed paying down a line of credit or funding faster-turning stock.
The SKU Proliferation Trap
SKU expansion carries hidden costs. Each new item requires a minimum stocking level to avoid stockouts. That level might sit for weeks or months before the first sale. If the product doesn’t catch on, you’ve parked capital in inventory that won’t convert back to cash anytime soon.
Imagine you bring in a new category of parts to capture a niche segment. You stock 50 SKUs to demonstrate range and availability. Half of them turn once a quarter. The other half turn twice a year. You’ve just committed cash to inventory that won’t pay back for six or twelve months, while your core products that turn weekly are starved of replenishment capital. That’s a cash drain masquerading as a growth initiative.
Distributors who don’t perform velocity analysis on SKUs end up carrying dead or slow inventory that looks fine on a spreadsheet but wrecks liquidity. The cost isn’t just tied-up cash. It’s also carrying costs like warehousing, insurance, handling, and risk of obsolescence or damage. If your DIO creeps from 25 days to 40 days because of slow movers, you’ve just extended the time your cash sits idle by 60%.
Not Adjusting Reorder Points During Growth
As sales volume climbs, many distributors keep using the same safety stock and reorder triggers they set years earlier. That means you’re now holding twice the inventory you need to service the same relative demand variability. Doubling inventory levels without updating procurement policy turns a liquidity asset into a liquidity anchor.
Safety stock exists to buffer variability in demand or lead time. But if your growth is steady and predictable, holding extra buffer stock “just in case” is expensive insurance. Revisit your reorder points quarterly. Model lead times and forecast accuracy. Tighten buffers where data supports it and focus your cash on fast movers that generate quick turns and margin.
Mistake #2: Letting Days Sales Outstanding (DSO) Drift Without Active Collections
Revenue growth often comes with a hidden concession to customers. Bigger orders mean bigger negotiating power. One of the first levers customers pull is payment terms. What started as Net 30 becomes Net 45 or Net 60. Suddenly you’re financing your customer’s working capital instead of your own.
DSO creep is insidious because it happens deal by deal, not as a single policy change. One large account gets extended terms to close the contract. Another gets a grace period after a late payment because you don’t want to lose the relationship. Before you know it, your average DSO has drifted from 35 days to 50 days. You’ve added two weeks of cash float that you’re funding internally.
Benchmark data shows healthy wholesale DSO between 30 and 45 days. If you’re pushing past 50, you’re outside the norm and you’re likely bleeding cash. Every five-day increase in DSO is another week your money sits in someone else’s account instead of yours.
Extended Payment Terms as a Competitive Weapon
Offering longer payment windows to land large accounts feels like a smart competitive move. It removes a barrier to the sale and signals trust and partnership. Unless you model the cash impact, you’re trading short-term revenue for long-term liquidity risk.
Say a major retailer wants Net 90 instead of your standard Net 30. That’s an extra 60 days your cash is tied up. If the order is $500,000, you’ve just loaned them half a million dollars interest-free for two months. Multiply that across multiple large accounts and you’ve built a shadow financing business with zero return and significant risk if any of those customers slow-pay or default.
The trade-off isn’t always bad, but it has to be intentional. Price in the cost of extended terms. Ask for volume commitments or exclusivity clauses in return. If the customer won’t move on price or commitment, build the cost of financing that float into your margin or decline the deal.
Reactive vs. Proactive Collections Management
Most distributors treat collections as a back-office cleanup task. Invoices go out. If customers don’t pay by the due date, someone sends a reminder a week or two later. By then, you’re already behind. Proactive collections management means monitoring aging from day one and intervening before accounts become delinquent.
Here’s what that looks like in practice:
- Send invoices immediately upon shipment, not at month-end.
- Automate reminders three days before the due date and one day after.
- Call customers personally once invoices hit 15 days past due.
- Offer early payment discounts to incentivize faster collection.
- Track DSO weekly, not monthly, and flag any account trending upward.
- Review credit limits quarterly and tighten them for slow payers.
These steps keep cash moving and prevent small delays from becoming liquidity crises. Customers who know you track closely are less likely to deprioritize your invoices.
Mistake #3: Supplier Terms (DPO) Not Scaling with Growth
When you’re small, suppliers often give you conservative payment terms. Maybe you’re on prepay or COD until you build a track record. As you grow and order volumes increase, your leverage improves. Many distributors never revisit payment terms with suppliers, leaving a massive cash lever on the table.
Days Payables Outstanding is the interest-free loan your suppliers give you. If you’re buying more inventory and paying faster than you have to, you’re funding your growth with internal cash instead of using your suppliers’ credit. That’s a strategic miss.
Benchmark wholesale DPO ranges from 45 to 65 days. If your DPO is stuck at 30 days while your competitors stretch to 60, you’re giving back 30 days of float. That float compounds across every purchase order. It adds up to hundreds of thousands of dollars in unnecessary cash consumption.
The Imbalance: Growing Inventory Without Growing Payment Float
Here’s the math that kills distributors. Your inventory doubles to support revenue growth. That’s fine if your DPO doubles too, because your suppliers are effectively financing that growth. But if DPO stays flat, you’re carrying the full cost of the inventory buildup on your balance sheet.
Say you’re holding $2 million in inventory and paying suppliers in 30 days. If you grow inventory to $4 million and still pay in 30 days, you’ve added $2 million to your cash needs. But if you negotiate payment terms to 60 days on the new volume, your suppliers are now financing half of that $4 million. Your cash need only rises by $1 million.
The imbalance between inventory growth and payment float is where cash burn accelerates. Growth that looks healthy on an income statement becomes a liquidity disaster on a cash flow statement.

Missed Opportunities to Negotiate Volume Discounts and Extended Terms
Distributors focus heavily on unit cost when negotiating with suppliers. Can we shave 2% off the per-unit price if we order in larger quantities? That’s a good question, but it’s incomplete. Payment terms matter just as much, if not more, than price.
When you renegotiate contracts or hit volume thresholds, ask for both. Here’s a simple checklist for supplier term discussions:
- Request extended payment terms proportional to order volume increase.
- Ask for early payment discount structures like 2/10 Net 60.
- Negotiate seasonal terms if your demand is lumpy.
- Propose tiered DPO based on order size brackets.
- Lock in terms annually and revisit at contract renewal.
Suppliers want your business. If you’re a reliable, growing customer, they’ll often extend terms to keep the relationship. You have to ask.
Mistake #4: No Rolling Cash Forecast or Visibility into Cash Conversion Cycle (CCC)
Cash flow forecasting isn’t a luxury for distributors. It’s the diagnostic tool that catches working capital problems before they become crises. Without it, you’re flying blind.
Your cash conversion cycle is the single most important metric for liquidity health. It’s calculated as DIO plus DSO minus DPO. That number tells you how many days your cash is tied up in operations before it comes back. If your CCC is 40 days, you’re floating 40 days of working capital at any given time. If it climbs to 60 days, you’ve just added three weeks of capital needs overnight.
Monitoring CCC should be non-negotiable. It’s the early warning system for every mistake we’ve covered so far. If DIO creeps up, CCC rises. If DSO drifts, CCC rises. If DPO shrinks, CCC rises. And when CCC rises without a plan to fund it, cash evaporates.
Why 13-Week Rolling Forecasts Beat Annual Budgets
Annual budgets are useful for strategy. They’re terrible for managing liquidity in a volatile, growing distribution business. A 13-week rolling cash forecast gives you real-time visibility into when cash will hit and when it’ll leave. That precision lets you plan borrowing, negotiate terms, and time purchases.
Static annual forecasts assume even cash flows and predictable timing. Distribution reality is lumpy. Big orders come in bursts. Customers pay late. Seasonal demand swings. A rolling weekly forecast captures all of that and updates as conditions change. You can see four weeks out if you’ll be short and arrange a draw on your line of credit before it’s urgent.
Building a CCC Dashboard
A minimal viable cash dashboard for a distributor should track four numbers weekly:
- DIO: How many days is inventory sitting before it sells?
- DSO: How many days until customers pay invoices?
- DPO: How many days until you pay suppliers?
- CCC: DIO plus DSO minus DPO.
Add seasonally adjusted benchmarks so you know when you’re drifting outside healthy ranges. For wholesale distributors, healthy thresholds are roughly 20 to 30 days DIO, 30 to 45 days DSO, and 45 to 65 days DPO. If your CCC climbs above 30 to 40 days, you’re in warning territory. Above 50 days, you’re in the red zone.
Track these numbers in a simple spreadsheet or dashboard and review them every Monday morning. If you see CCC trending up, dig into which component is driving it and fix it before it compounds.
The Three-Mistake Cascade: How Small Errors Compound into Liquidity Crisis
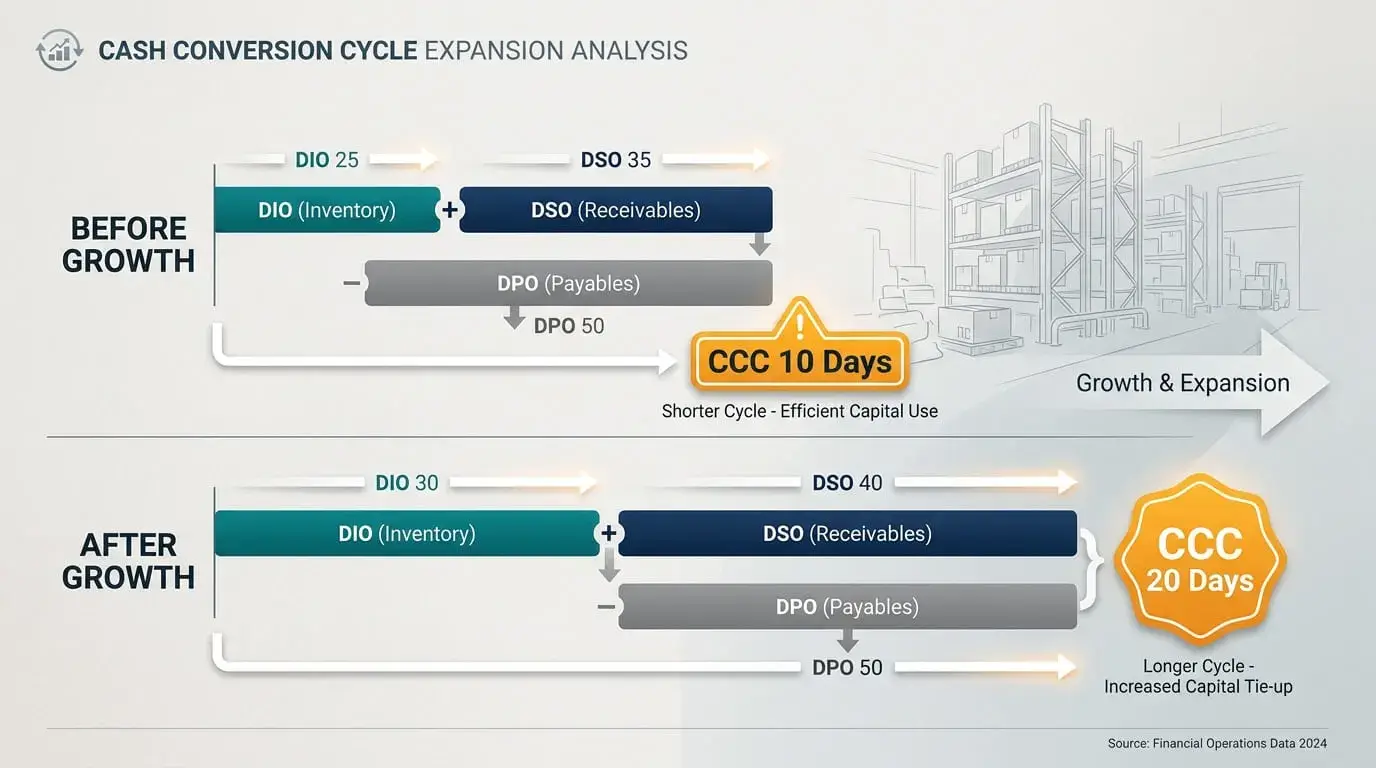
Let’s watch how Mistakes 1, 2, and 3 interact in real time. A distributor grows revenue 30% year over year. To support that growth, they add SKUs and raise inventory levels. DIO increases from 25 days to 30 days, a 20% jump. They land a large national account that demands Net 60 instead of Net 30. DSO increases from 35 days to 40 days, a 15% jump. But they never renegotiate supplier terms. DPO stays flat at 50 days.
Here’s what that does to their cash conversion cycle:
| Metric | Before Growth | After Growth | Change |
|---|---|---|---|
| DIO | 25 days | 30 days | +5 days |
| DSO | 35 days | 40 days | +5 days |
| DPO | 50 days | 50 days | 0 days |
| CCC | 10 days | 20 days | +10 days |
Their CCC doubled. That means they now need to float twice as much working capital to operate. If their daily cash operating cost is $50,000, they just added $500,000 in permanent working capital needs. That’s half a million dollars that has to come from somewhere: a line of credit, retained earnings, or external financing. If they don’t plan for it, they’ll burn through cash reserves and hit a liquidity wall.
It leads to a slow, predictable bleed that starts with reasonable business decisions, none of which looked dangerous in isolation, but all of which compounded into a cash crisis.
What to Do Instead: The Working Capital Discipline Framework
Prevention beats reaction. Here’s a structured plan to avoid the cash consumption traps and keep liquidity healthy even during aggressive growth.
Step 1: Establish Baseline CCC and Set Targets
Start by calculating your current DIO, DSO, and DPO. Use rolling 90-day averages to smooth out noise. Compare those numbers to industry benchmarks. For wholesale distribution, aim for DIO under 30 days, DSO under 45 days, and DPO above 45 days. That gives you a baseline CCC in the low 30s or better.
Set a target CCC your business can sustain. If you’re growing 20% annually, model what your working capital needs will be at that CCC. Build a buffer. Commit to monitoring progress monthly.
This step is analytical but motivating. Once you see the numbers, it becomes obvious where the leaks are and how much opportunity sits in fixing them.
Step 2: Link Revenue Growth Targets to Working Capital Capacity
Before you commit to a growth target, model the cash impact. If you’re planning 25% revenue growth, ask: what happens to inventory? What happens to receivables? What happens to payables? Will suppliers extend terms proportionally or will you fund the growth internally?
This is the difference between growth funded from operations and growth requiring external capital. If your cash conversion cycle expands with growth, you’ll need a line of credit, a revolver, or equity to bridge the gap. Plan for it before you commit, not after you’re already underwater.
Build a simple scenario model. Take your current CCC and apply it to next year’s revenue forecast. That tells you how much working capital you’ll need. If the number is bigger than your available cash and credit, either shrink the growth plan or secure financing up front. Reach out to advisors like those at morganfractionalcfo.com to build this model if you don’t have the internal bandwidth.
Step 3: Monitor and Adjust Monthly
Set a recurring monthly review of DIO, DSO, DPO, and CCC. Compare to trend and to target. If any metric is drifting, investigate immediately. Did a slow-moving SKU inflate DIO? Did a large customer stretch payment? Did a supplier tighten terms?
Monthly tracking gives you early warning. You can adjust purchasing, tighten collections, or renegotiate terms while the problem is still small. Annual reviews come too late. By the time you notice a CCC spike in a yearly financial review, you’ve already burned through months of cash.
Create a simple scorecard or dashboard. Share it with your leadership team. Make working capital a standing agenda item in monthly finance meetings. The visibility alone drives accountability.
If you’re operating without a finance leader who can own this, consider bringing in fractional CFO support to set up the framework and train your team. It’s a high-ROI investment that pays back in avoided cash crises and better capital deployment. Many distributors work with part-time finance executives who provide this oversight without the cost of a full-time hire.
Key Takeaway: Growth Without Working Capital Discipline Is Illusion
Revenue growth looks like success on an income statement, but it can be a mirage if your cash is bleeding out faster than profit is coming in. Working capital management is the leading indicator. Revenue is the lagging one. If you track only the lag, you’ll celebrate growth right up until you can’t make payroll or pay suppliers.
Distributors who master their cash conversion cycle, monitor DIO, DSO, and DPO actively, and align supplier and customer terms with growth targets can scale without liquidity stress. Those who ignore these mechanics will eventually face a forced recapitalization, a distressed sale, or worse.
Audit your CCC today. Model your working capital needs before the next round of growth hits. If you don’t have the internal horsepower to do this work, bring in the expertise. The cost of inaction is far higher than the cost of prevention.
For distributors ready to take control of their working capital and build growth that doesn’t consume cash, morganfractionalcfo.com offers the strategic finance support you need to model, monitor, and manage liquidity with precision.
Frequently Asked Questions
Why does distributor revenue growth often reduce cash flow?
Growth increases the need for inventory and extends receivables before cash from new sales arrives. If you’re adding stock and giving customers time to pay while your supplier terms stay fixed, cash flows out faster than it flows back in. That gap is your cash conversion cycle. When it widens, liquidity shrinks even as revenue climbs.
How do DIO, DSO, and DPO affect cash conversion cycle in distribution?
DIO measures how long inventory sits before selling. DSO measures how long it takes customers to pay. DPO measures how long you take to pay suppliers. Your cash conversion cycle is DIO plus DSO minus DPO. A higher DIO or DSO increases the cycle. A higher DPO decreases it. The longer your cycle, the more working capital you need to float operations.
What is a healthy working-capital cycle for wholesale distributors?
Healthy wholesale distributors typically run DIO between 20 and 30 days, DSO between 30 and 45 days, and DPO between 45 and 65 days. That produces a cash conversion cycle in the range of 5 to 30 days. Anything above 40 days signals tightening liquidity and requires attention.
How much inventory should a distributor hold during expansion?
Inventory should scale with sales velocity, not just revenue. Use ABC classification to focus stock on fast-moving, high-margin items and minimize slow movers. Set reorder points based on lead time and forecast accuracy, not historical safety stock levels. As you grow, revisit those triggers quarterly to avoid overbuying.
Why do receivables grow faster than sales in distribution businesses?
Receivables grow faster when customers negotiate longer payment terms or when collections slow. A 20% revenue increase combined with a shift from Net 30 to Net 60 can double the growth rate of receivables compared to sales. Without active DSO management, that gap compounds and drains cash.
What payment terms are typical for wholesale distribution?
Standard wholesale terms range from Net 30 to Net 45. Large retailers often push for Net 60 or Net 90. Suppliers typically offer Net 30 to Net 60, with early payment discounts like 2/10 Net 30 common. The key is balancing customer and supplier terms to minimize your cash conversion cycle.
How can wholesale distributors preserve cash flow during expansion?
Preserve cash by negotiating extended supplier terms as order volumes grow, tightening collections to minimize DSO drift, pruning slow-moving SKUs to improve inventory turns, and building a rolling 13-week cash forecast to anticipate shortfalls before they arrive. Consider using financing tools like invoice factoring or asset-based revolvers to bridge working capital gaps without straining operating cash.
What working capital options fit wholesale distributor scaling best?
Asset-based revolvers and lines of credit work well for ongoing liquidity needs tied to inventory and receivables. Invoice factoring or financing can unlock cash from slow-paying customers. Short-term working capital loans help fund large seasonal buys or bulk orders. Revenue-based loans offer flexible repayment tied to sales volume. The best fit depends on your growth speed, CCC profile, and cost of capital tolerance.