
Quick answer: the right way to calculate debt-to-equity ratio
Pick your numerator, pull shareholders’ equity from the same reporting date, divide, and state the answer as a multiple. The debt to equity ratio formula is debt divided by total shareholders’ equity, where “debt” means either total liabilities or only interest-bearing borrowings depending on who asked for the number.
That choice decides whether the calculation is right or useless. The same balance sheet can produce 2.4 under total liabilities and 0.9 under funded debt only, and neither figure is wrong until you compare it to something built the other way. The second rule is date consistency: numerator and denominator come from one balance sheet, one reporting date, no exceptions.

Before you start: what you need and when this method fits
You need a balance sheet, a stated reporting date, and a decision about what counts as debt before you touch a calculator. That last item is the one most people skip, and it’s the reason two analysts produce two different ratios from identical statements.
Materials checklist:
- A full balance sheet as of one date, with current liabilities and long-term liabilities broken out
- The total shareholders’ equity line, including retained earnings and any treasury stock
- A debt schedule or note listing short-term borrowings, the current portion of long-term debt, term loans, revolver balances, and finance leases
- The lender’s covenant definition, if the number is going to a bank
- A comparable company or industry range calculated under the same definition
According to the SEC, a balance sheet reports assets, liabilities, and shareholders’ equity as of the end of the reporting period, which is exactly why the date matters more than the arithmetic.
When this method fits: positive equity, books that close on a schedule, and a clear purpose for the number. When it doesn’t fit: equity at or near zero, equity negative from accumulated losses or distributions, or a balance sheet that hasn’t been reconciled in three months.
Step 1: Pull the balance sheet for one reporting date
Open the balance sheet for the period you’re reporting on and write down the date at the top of your worksheet before anything else. Every figure you use after that comes from that one statement.
Mixing periods is the quietest error in this calculation. A company that borrowed $2M in October and closed its fiscal year in December will show a different debt figure at each date. Pair September debt with December equity and you’ve produced a number that describes no moment in the company’s life. The ratio stops being comparable to its own history, which is the main thing a lender or a board wants from it.
Where the data comes from changes what you watch for:
- Accounting software: run the balance sheet as of a closed period, not today. An open month pulls in partial activity and unposted entries.
- Lender package: confirm whether the statements are compiled, reviewed, or internal, and whether they’ve been adjusted since you sent them.
- Public filing: quarterly and annual statements use different cut-offs and different levels of review. Pick one and stay there.
Here’s the full extract, every line that feeds the calculation, from one e-commerce retailer’s year-end statement:
| Balance sheet line | Amount |
|---|---|
| Accounts payable | $1,420,000 |
| Accrued liabilities | $385,000 |
| Current portion of long-term debt | $640,000 |
| Long-term debt | $2,180,000 |
| Amounts payable to related parties | $395,000 |
| Total liabilities | $5,020,000 |
| Common shares | $250,000 |
| Preferred shares | $400,000 |
| Retained earnings | $1,118,000 |
| Dividends declared | ($100,000) |
| Total shareholders’ equity | $1,668,000 |
Total liabilities of $5,020,000 divided by equity of $1,668,000 gives 3.01:1. Every line above came off one statement carrying one date at the top.
The mistake to avoid: using a trailing-twelve-month figure for anything here. Debt-to-equity is a point-in-time measure taken from a snapshot, not an average over a period. Income statement thinking doesn’t apply.
Step 2: Decide what counts as debt
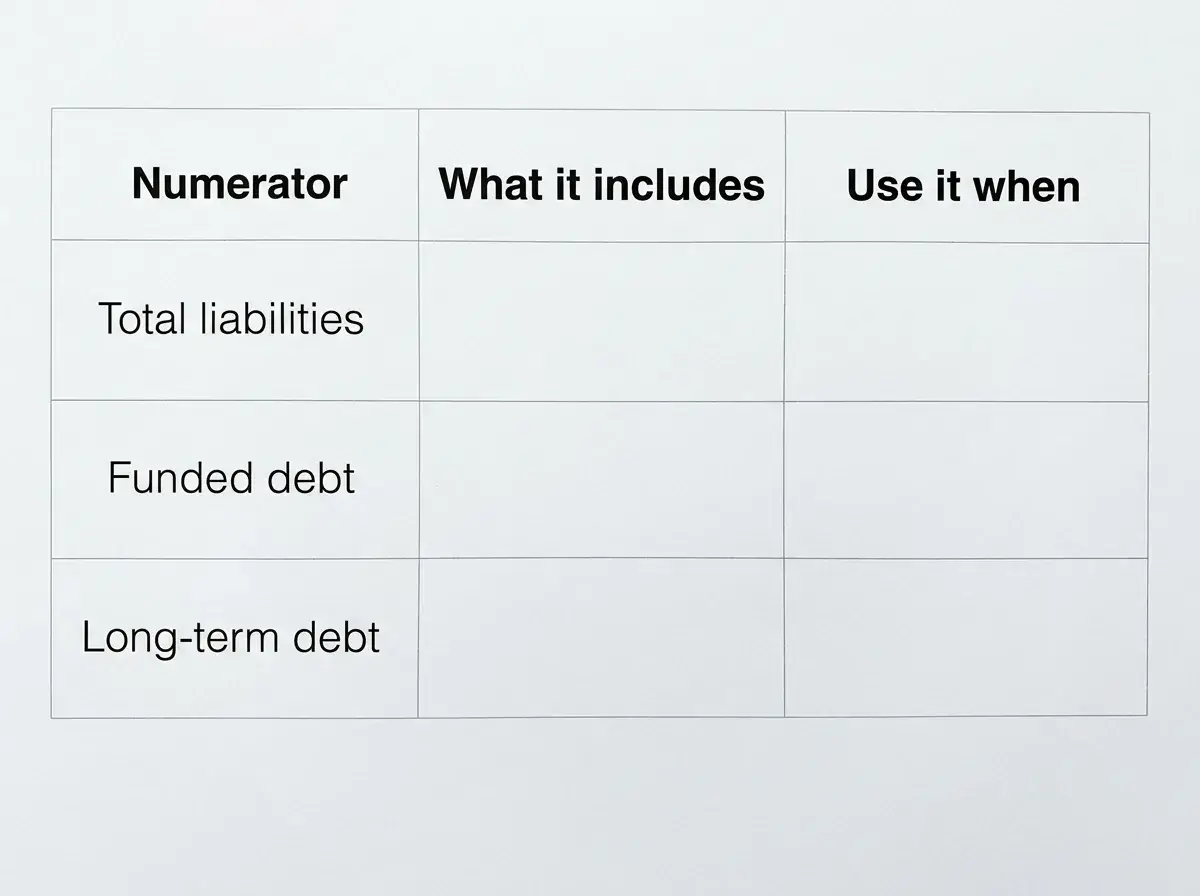
Use total liabilities when you’re measuring the company’s full obligation to everyone outside the equity holders. Use interest-bearing debt when the question is about funded borrowing, repayment capacity, or a bank covenant. Show both when the audience or the purpose is unclear.
Here’s the decision rule most explainers leave out:
| Numerator | What it includes | Use it when |
|---|---|---|
| Total liabilities | Accounts payable, accrued expenses, deferred revenue, taxes payable, all leases, all borrowings | Investor-style leverage review, comparing against a benchmark built on total liabilities, assessing claims ahead of equity |
| Funded debt | Short-term borrowings, current portion of long-term debt, term loans, revolver, finance leases | Bank underwriting, covenant tests, refinancing, any question about scheduled repayment |
| Long-term debt | Term debt maturing beyond twelve months | Structural financing risk, capital structure planning, not near-term liquidity |
The gaps between these are not cosmetic. One distributor at $6.0M total liabilities and $3.0M equity gives 2.0:1. Strip $3.3M of trade payables and accruals and funded debt of $2.7M gives 0.9:1. Drop the $1.1M current portion and long-term debt of $1.6M gives 0.53:1. One company, one date, three defensible answers.
Regulators sometimes write the definition down. Under federal rules governing certain U.S. Cornell Law School reports that operations of foreign banking organizations, the debt-to-equity ratio is defined as total liabilities to total equity capital less goodwill. That subtraction of goodwill is a reminder that a covenant definition can modify either side of the fraction.
The mistake to avoid: treating the three as interchangeable. If you calculate funded-debt D/E and compare it to a published industry figure built on total liabilities, you’ve manufactured a favorable result out of nothing. Name the definition every time you state the ratio.
Write the definition at the top of the worksheet, in words, before you pull a single number. “Funded debt including current maturities and finance leases, excluding trade payables.” Then build the numerator to match. People who calculate first and define afterward tend to define whichever way the answer looked better.
Step 3: Find shareholders’ equity and adjust for special cases
Total shareholders’ equity sits at the bottom of the balance sheet, below liabilities, and it’s the sum of contributed capital, additional paid-in capital, and retained earnings, less treasury stock. When equity is zero, the ratio is undefined and you don’t report one. When equity is negative, the ratio is mathematically negative and economically meaningless as a leverage reading.
Pull the total equity line, not a component of it. Using retained earnings alone, or paid-in capital alone, is a common slip in founder-led companies where the equity section has accumulated odd entries over the years: shareholder loans misposted as capital, distributions booked against income, S-corp basis adjustments that never got reconciled.
Negative equity happens for ordinary reasons. Years of distributions exceeding net income. A large impairment. A buyout of a departing partner funded with debt. String of losses. The arithmetic in each case is the same: $4.0M of liabilities divided by negative $500K of equity produces negative 8.0, a number that looks almost conservative next to a positive 3.0 and means the opposite.
What a good report does instead:
- States “equity is negative; D/E is not meaningful” in place of the ratio
- Shows the equity balance and the reason it went negative
- Substitutes a measure that still works, usually funded debt against EBITDA or interest coverage; lenders size loans off debt service coverage, and Debt Service Coverage Ratio: The Complete Guide carries those worksheets
The mistake to avoid: rounding before you divide. Equity of $108,400 rounded to $0.1M against $3.2M of liabilities gives 32.0 instead of 29.5. On a small denominator, rounding error swamps the signal. Divide the raw figures, round the answer.
Step 4: Divide debt by equity and state the ratio the right way
Divide your chosen debt figure by total shareholders’ equity and write the result as a multiple with a colon: 0.8:1, 1.5:1, 3.0:1. Two decimal places is enough for almost every purpose.
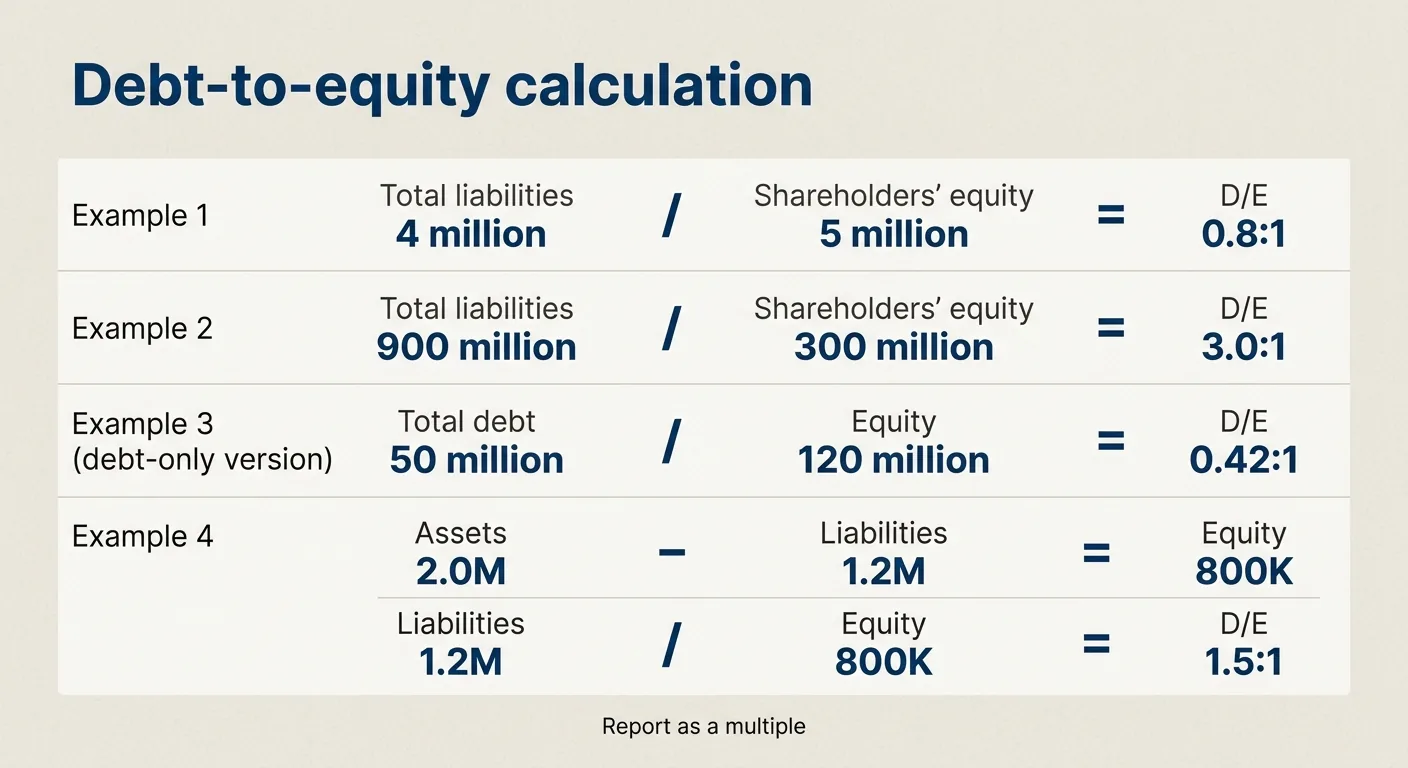
A debt-to-equity ratio example using round numbers. Total liabilities of $4 million against shareholders’ equity of $5 million gives 0.8, written 0.8:1. Eighty cents of liabilities behind every dollar of equity. Move the numbers: $900 million of liabilities against $300 million of equity gives 3.0:1, three dollars of liabilities per dollar of equity. A debt-only version with $50 million of total debt and $120 million of equity gives 0.4167, reported as 0.42.
If you only have assets and liabilities, back into equity first. Assets of $2.0M minus liabilities of $1.2M leaves $800K of equity, and $1.2M divided by $800K is 1.5:1. A debt to equity ratio less than 1 means equity exceeds the debt figure you chose, nothing more and nothing less. Say it in plain language when you present it: at 2.0:1, about 66 cents of every dollar of financing came from debt and about 33 cents came from equity, and a ratio around 2.0 to 2.5 is generally considered acceptable for an operating company with steady cash flow.
The mistake to avoid: calling 0.8 “80%.” The ratio is a multiple. Converting to a percentage is legitimate only when you say so and the whole report does it consistently, and even then it invites a reader to confuse D/E with debt-to-assets. State it as a multiple.
If your own number keeps landing somewhere different from what a bank or a data provider shows, a short conversation about the definition usually resolves it faster than another pass through the spreadsheet.
How to tell it worked: what a clean result looks like
A finished calculation is one ratio, from one reporting date, with a denominator that is neither zero nor negative. If any of those three is missing, the number isn’t ready to send to a lender, a board, or a buyer.
Sanity checks before you publish it:
- Name the definition on the output. The ratio has to travel with the words that built it, or someone will compare it to a figure built another way.
- Tie out the numerator. Add your debt components back and confirm they appear on the balance sheet at the same values. A funded debt total should tie to the debt schedule.
- Tie out the denominator. Total assets minus total liabilities should equal the equity you used. If it doesn’t, you grabbed a subtotal.
- Check the direction. Did the ratio move since last period, and does the reason show up in the statements? New term loan, a loss, a distribution, a buyback. Unchanged debt with a rising ratio means equity shrank.
- Compare to a peer calculated the same way. Software companies routinely run below 0.3; capital-intensive utilities often sit above 2.5. A number is only high or low against a comparable built under the same definition. A very low result carries its own critique: equity is the expensive money, and a board that funds growth entirely with it can post a 5 percent return where 15 percent was available, which minority shareholders tend to notice.
- Read it against something else. Pair the ratio with interest coverage or funded debt to EBITDA. Debt says what’s owed; those say whether it can be serviced. Funded debt to EBITDA keeps gaining ground for that reason, because it pulls cash flow into a measure the balance sheet alone can’t supply.
A clean one-line output reads like this: “Funded debt to equity, 0.9:1, as of 12/31/2025, including current maturities and finance leases.”
When to call a pro instead
Call someone when the definition is contested rather than unclear, which is most of the time a real decision rides on the number. Your ratio differs from a finance website because the site likely used book equity against short- and long-term borrowings only, or pulled a quarterly statement against your annual one, or deducted cash to show net debt. Reconciling those three conventions on one company takes an hour and settles the argument permanently.
The interest-bearing-debt-to-EBITDA ratio, IBD/EBITDA, is the measure that pulls cash flow into your view of the business, and it keeps gaining ground over a balance-sheet-only D/E because a snapshot of what’s owed says nothing about whether earnings cover the payments. That’s where a second pair of eyes pays for itself: showing which definition belongs on the covenant certificate, which belongs in the monthly management report, and how the two reconcile on one page so a lender never has to guess which number is yours.
The cases where doing it yourself costs more than it saves:
- A covenant in a signed loan agreement defines debt in a way that doesn’t match your reporting, and you find out at the test date
- Equity is negative and the lender wants an explanation, not a ratio
- A diligence process requires consistent ratios across three years of statements with mid-period acquisitions or lease standard changes
- You’re sizing new borrowing and need to know what the ratio will be after the draw, not what it is today
I’ve sat on the reporting side of this. As CFO of CertiPay, a $285M PEO, ASO, and B2B payroll software business, we moved $3.5B of client payroll for 90,000 worksite employees, earned a first IRS CPEO certification in 120 days after two years of failure, and met the bank’s reporting requirements in 180 days, which opened a 2X credit line. The ratios didn’t change the week we fixed the reporting; what changed was that every number carried its definition and tied to the statements.
If leverage reporting is about to be tested by a lender, a buyer, or a board, book a 15-minute call and bring the balance sheet you are working from.

Frequently Asked Questions
What does a 1.5 debt-to-equity ratio mean?
It means $1.50 of debt for every $1.00 of equity under whichever definition you used. On a balance sheet with $1.2M of liabilities and $800K of equity, that’s exactly where 1.5:1 comes from. Whether 1.5 is comfortable depends on the sector and on whether cash flow covers the scheduled payments.
Is 0.5 a good debt-to-equity ratio?
A 0.5:1 result means equity is twice the debt figure, which reads conservative in most industries and is unremarkable in asset-heavy ones. A software company at 0.5 looks levered next to peers below 0.3, while a utility at 0.5 would be unusually unlevered. Compare against peers calculated the same way before calling it good.
What is the ratio for debt-to-equity?
Debt divided by total shareholders’ equity, expressed as a multiple. The numerator varies: see the table in Step 2 for when to use total liabilities versus funded debt. State the definition alongside the number every time, because the same balance sheet supports more than one defensible answer.
Do accounts payable and leases count as debt in the debt-to-equity ratio?
Payables count under a total-liabilities definition and are excluded under a funded-debt definition. Finance leases are fixed-payment obligations and belong in the numerator whenever the question is repayment capacity. Operating leases depend on the convention your lender or data provider uses, so ask before you assume.
What is the difference between book equity and market equity in D/E calculations?
Book equity is the balance sheet figure: contributed capital plus retained earnings, less treasury stock. Market equity is shares outstanding times share price, which for a profitable asset-light company can run several times book and for a struggling one can sit below it. A D/E built on market equity usually prints lower, so a data provider using it will never match your statements. A private company has no market equity, which leaves book as the only workable denominator.
How does a dividend, stock buyback, loss, or new loan change the debt-to-equity ratio?
A new loan raises the numerator. A distribution, buyback, or operating loss cuts retained earnings and shrinks the denominator. A company that borrows nothing new can still watch its ratio climb from 1.2 to 1.8 in a year on losses alone, which is why a rising ratio always deserves a look at the equity section first.
What is the difference between debt-to-equity and debt-to-assets?
Debt-to-equity divides debt by shareholders’ equity; debt-to-assets divides debt by total assets. Debt-to-assets can never exceed 1.0 for a solvent company, while debt-to-equity has no upper bound. Swapping the denominators by accident is one of the more common calculation errors.
Is there a regulatory limit on debt-to-equity for any kind of company?
Operating companies have no statutory cap, though loan covenants often set one. Certain regulated entities do face hard limits: a foreign banking organization’s U.S. intermediate holding company or certain U.S. subsidiaries must achieve and maintain a debt-to-equity ratio of no more than 15-to-1. For everyone else, the binding constraint is the covenant in the credit agreement.