
According to Atlassian, a profit and loss statement sets out revenue, costs and profit across a period you choose: a month, a quarter, or a year. If you need one today for a lender, a landlord, a grant file, or a Monday management meeting, you don’t need software. You need a layout, your trial balance, and twenty minutes. Copy any of the blocks below into a spreadsheet, replace the bracketed placeholders, and you have a statement a third party will recognize.

When and how to use these profit and loss statement templates
Pick the template that matches your reporting period and your accounting basis before you type a single number. That’s the one rule. A monthly profit and loss statement built on cash receipts will not reconcile to an accrual year-end. A lender who asks for trailing twelve months will not accept a single month with a year-to-date column bolted on.
Wise reports that four build methods exist, and the template you choose quietly commits you to one: single-step, where total revenues minus total expenses equals net income.; multi-step, which breaks out gross profit and operating income; cash basis, which records money when it moves; accrual basis, which records revenue when earned and cost when incurred. Most of the blocks below are multi-step, because that’s what shows you where margin is being made or lost.
One more practical note. If you file as a sole proprietor, keep your expense labels close to your Schedule C categories so the year-end handoff takes an hour instead of a week.
| Template | Format | Use when |
|---|---|---|
| Basic monthly | Spreadsheet or PDF | You need one clean period for a lender, landlord or grant file |
| Monthly with year-to-date columns | Spreadsheet | You run a monthly management meeting and want trend, not snapshot |
| Service company | Spreadsheet | Labor and subcontractors are your cost of delivery, not overhead |
| Annotated example | Reference | You want to see where a line item belongs before you classify your own |
Basic monthly profit and loss statement template
This is the short multi-step layout: revenue, direct costs, gross profit, operating expenses, net income. Copy it as is.
[Company Name]
Profit and Loss Statement
For the month ended [Month Day, Year] Basis: [cash / accrual]

Revenue
Product or service revenue $[amount]
Other operating revenue $[amount]
Total revenue $[amount]

Cost of goods sold / direct costs
Materials $[amount]
Direct labor $[amount]
Subcontractors $[amount]
Total direct costs $[amount]

Gross profit $[amount]
Gross margin [gross profit / revenue]%

Operating expenses
Payroll and benefits (non-delivery) $[amount]
Rent and occupancy $[amount]
Software and subscriptions $[amount]
Marketing and advertising $[amount]
Insurance $[amount]
Professional fees $[amount]
Depreciation and amortization $[amount]
Other operating expenses $[amount]
Total operating expenses $[amount]

Operating income $[amount]

Other income $[amount]
Interest expense $[amount]
Income taxes $[amount]

Net income / (loss) $[amount]
Net margin [net income / revenue]%
Use it when someone outside the business asked for one period and nothing more. It works because the basis line sits at the top, so no reader has to guess whether your numbers are cash or accrual.
Monthly template with year-to-date columns
Same line items, two more columns. This is the version that belongs in a management meeting, because one month on its own tells you almost nothing about direction.
[Company Name] Profit and Loss [Month, Year] Basis: [cash / accrual]

Line item Month YTD Prior YTD
Total revenue $[amt] $[amt] $[amt]
Total direct costs $[amt] $[amt] $[amt]
Gross profit $[amt] $[amt] $[amt]
Gross margin % [ %] [ %] [ %]
Total operating expenses $[amt] $[amt] $[amt]
Operating income $[amt] $[amt] $[amt]
Net income / (loss) $[amt] $[amt] $[amt]
Use it when you review results monthly. A twelve-month version of this tracks monthly and year-to-date revenue and expenses, totals them, and feeds simple charts for gross profit and profit or loss over time. Month columns catch the spike. Year-to-date columns tell you whether the spike mattered.
Small business service-company profit and loss statement template
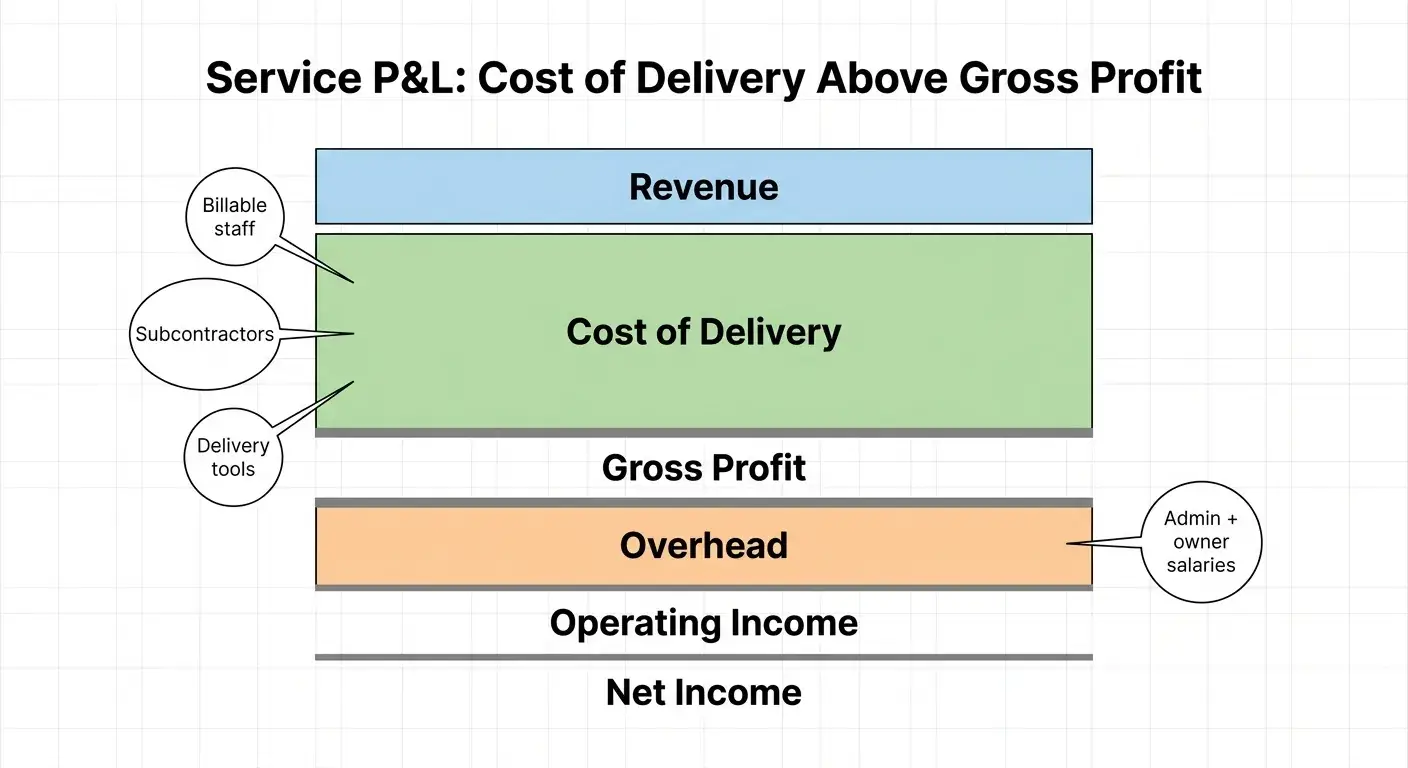
In a service business, billable labor and subcontractors are direct costs. They belong above the gross profit line, not in overhead, because they rise and fall with delivered work. Put them in operating expenses and your gross margin looks flattering and useless.
[Company Name]
Profit and Loss Statement
For the [month / quarter] ended [Month Day, Year] Basis: accrual

Revenue
[Retainer / recurring fees] $[amount]
[Project or hourly fees] $[amount]
[Pass-through or reimbursed revenue] $[amount]
Total revenue $[amount]

Cost of delivery
Billable staff wages and payroll taxes $[amount]
Subcontractors and freelancers $[amount]
[Media, licenses, or hosting resold] $[amount]
Delivery software and tooling $[amount]
Merchant and payment processing fees $[amount]
Total cost of delivery $[amount]

Gross profit $[amount]
Gross margin [ %]

Overhead
Owner and admin salaries $[amount]
Sales and marketing $[amount]
Rent, insurance, professional fees $[amount]
Depreciation and amortization $[amount]
Total overhead $[amount]

Operating income $[amount]
Interest and taxes $[amount]
Net income / (loss) $[amount]
Use it when you run an agency, a BPO, a PEO or workforce services firm, a software team selling implementation work, or any fee-based operation with no inventory. What each profit line is actually telling you is covered below in How to read gross profit, operating income, and net income.
Profit and loss statement example for a business with direct costs and overhead
Here’s a completed, illustrative example for a call center with roughly $18 million in annual revenue. The numbers are invented for teaching, not drawn from a real company. The point of the annotations is classification: where each cost sits, and why.
Illustrative Call Center, Inc.
Profit and Loss Statement, Month ended March 31, 2026 (accrual)

Total revenue $1,500,000

Direct costs
Agent wages and payroll taxes $780,000
Supervisors and QA $95,000
Telephony, dialer and per-minute costs $42,000
Production floor occupancy $38,000
Total direct costs $955,000

Gross profit $545,000 (36.3%)

Operating expenses
Admin and executive salaries $180,000
Sales and marketing $55,000
Corporate rent and insurance $34,000
Software and IT (non-delivery) $30,000
Professional fees $12,000
Depreciation $20,000
Total operating expenses $331,000

Operating income $214,000 (14.3%)
Interest expense $11,000
Income taxes $48,000
Net income $155,000 (10.3%)
Annotation box: why each line sits where it does
- Supervisors and QA are direct costs. Headcount here scales with seats and program volume. Park them in overhead and gross margin jumps about six points on exactly the same work.
- Telephony and per-minute charges are direct. They vary with call volume, so they belong next to the revenue they produce.
- Admin salaries stay in overhead. They don’t move when a client adds twenty seats, which is the whole test.
- Depreciation stays below gross profit unless the asset is dedicated to delivery. Mixing it in makes margin by client impossible to read.
- Net income is the bottom line, the profit left after every expense is deducted. It’s a profit figure, not a bank balance.
That classification work is what makes margin by customer possible. At CertiPay, where I was CFO, a platform modernization cut labor cost 17 percent and produced the company’s first customer-profitability reporting. You can’t find a result like that in a P&L where delivery labor is buried in overhead. If you want a second pair of eyes on how your own statement is built, a 15-minute call is usually enough to see whether the classification is holding.
How to read gross profit, operating income, and net income
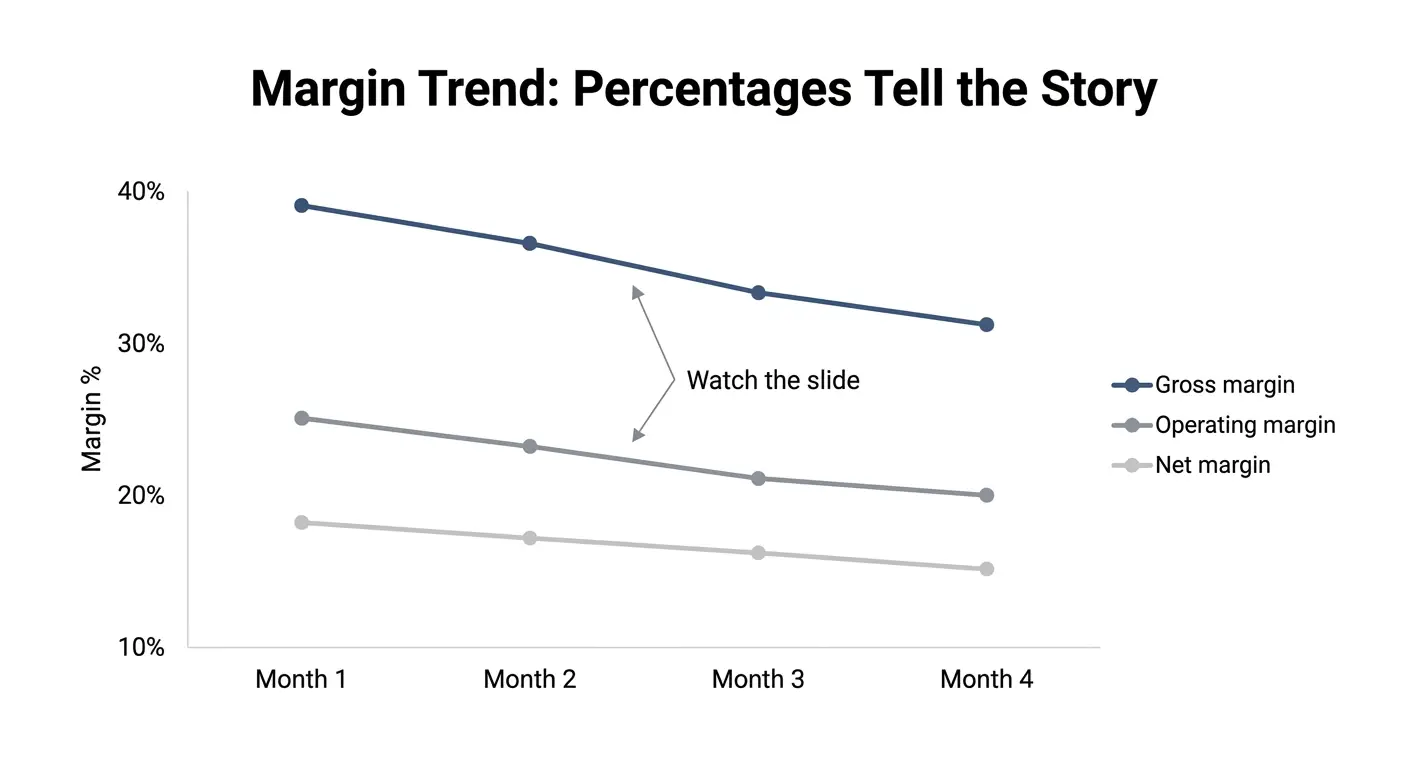
Three lines, three different questions. Gross profit answers whether the work itself pays: revenue minus the cost of delivering it. Operating income answers whether the business pays after you carry the overhead that delivery doesn’t touch. Net income As Xero notes, net income* answers what the owners kept after interest and taxes, and the bottom line is the part most readers go to first, since it shows what the business earned or lost in the period.
Read them as percentages, not dollars. A gross margin that slides from 38 percent to 31 percent over four months is the signal. The dollar total can rise the whole time and hide it.
What to avoid when using a public profit and loss statement template
The fastest way to produce a wrong statement is to download a correct template and fill it badly. Two risks dominate: mixed accounting bases, and leftover sample data.
| Do | Don’t |
|---|---|
| State the basis at the top and keep it all period | Mix cash receipts with accrual revenue in one column |
| Delete every sample number and placeholder formula before entering yours | Leave a template’s demo totals or broken SUM ranges in the file |
| Record owner draws and distributions on the balance sheet as equity | Book owner draws as an operating expense |
| Split loan payments: interest on the P&L, principal to the balance sheet | Expense the full loan payment |
| Treat sales tax collected as a liability | Report it inside revenue |
| Capitalize equipment and expense the depreciation | Expense a $40,000 equipment purchase in one month |
| Redact customer names, bank details, tax IDs and payroll detail before sharing an example | Email a working file with client-level data in it |
| Label the file as internally prepared | Present a spreadsheet as audited or reviewed |
Categorizing every bank transaction doesn’t finish the job. Run this checklist before the statement leaves your desk:
- Bank and credit card accounts reconciled to the statement balance
- Unpaid supplier bills entered for the period
- Unpaid customer invoices recorded as revenue if you are on accrual
- Depreciation posted for the month
- Inventory counted and cost of goods adjusted
- Payroll liabilities accrued, including the unpaid portion of the last pay period
- Income tax accrual updated
Make the template your own
Adapting these is a matter of period and labels, never logic. Keep the sequence from revenue to gross profit to operating income to net income, then change what sits around it.
- Monthly: the standard management cadence, with year-to-date and prior-year columns.
- Quarterly: four quarter columns across one year, which suits seasonal operators.
- Annual: gross sales, cost of sales, operating expenses, and net income before and after taxes, for year-over-year comparison.
- Forecast or pro forma: the same annual layout with projected figures, used for projections rather than history.
Swap line items to match how you actually sell. A distributor splits direct costs into product cost, freight in, and merchant fees. A SaaS company splits revenue into subscription and services, then puts hosting and support in cost of delivery. An e-commerce retailer separates returns and discounts so net sales is honest. Keep the labels identical from period to period, or your trend lines are fiction.
Then set a review rhythm. In my first 90 days with a client, weeks 1 and 2 go to cash, reporting and process. Weeks 3 to 6 build the forward plan. Weeks 7 to 12 fix the top profit or cash leak and lock in that review cadence. Copy the structure, fill in your numbers, and if the statement still does not explain where your margin went, book a 15-minute call and we will look at it together.
Frequently Asked Questions
How can I get a profit and loss statement?
Export the trial balance from your accounting system for the period you want, then map each account into one of the blocks above: revenue, direct costs, operating expenses, other income and expense. Most owners can produce a clean monthly statement in under an hour once the chart of accounts is mapped. If the trial balance is messy, fix it there rather than in the spreadsheet, or you’ll redo the work every month.
Why does my business show a profit on the P&L when there’s barely any money in the bank?
Profit and cash separate in five predictable places. Walk them in order: receivables (revenue you earned but haven’t collected), payables (costs you owe but haven’t paid), inventory or prepaid spend (cash out with no expense yet), loan principal (cash out that never touches the P&L), owner draws and distributions (equity movements that are not expenses). A 13-week cash view is a rolling picture of money in and out. Once someone owns it, an owner can answer what cash looks like in 90 days in about 30 seconds.
Is a profit and loss statement the same as an income statement?
Yes. According to Harvard Business School Online, income statements are also known as profit and loss statements, and some filings call the same report a statement of operations. The title changes, the content doesn’t: income and expenses over a defined period.
What are the 3 main financial statements?
the U.S. Securities and Exchange Commission reports that most people mean the income statement, the balance sheet and the cash flow statement, though the regulator counts four by adding the statement of shareholders’ equity. They answer different questions. The P&L only answers the performance one. The full breakdown of how the statements connect is in “financial statements”.
Can I use a public P&L template for a lender or grant application?
Yes, as long as you label it as internally prepared and state the accounting basis on the face of the statement. Lenders often want trailing twelve months plus the two most recent fiscal years, so build the monthly version first and roll it forward. Never describe a spreadsheet you built as audited or reviewed. That’s a representation you can’t support.
Should direct labor be listed under COGS or operating expenses?
Direct labor belongs in cost of goods sold or cost of delivery when the hours are tied to serving a customer: billable staff, agents on a program, technicians on a job. Supervisory time that scales with volume usually goes there too. Admin and executive salaries stay in operating expenses. The test is simple: if headcount moves when volume moves, it’s a direct cost.